Good practice in credit risk management is to turn periodic core banking data (eg. portfolio balance vs arrears) into meaningful information for ongoing portfolio monitoring and loan loss analysis. The process of transforming raw data into meaningful information to support business decisions is denoted by the term ‘Business Intelligence’ (BI). This can provide banks and other commercial lenders with better visibility and management of credit risk across commercial credit portfolios.
Commercial credit risk arises when borrowers cannot fulfill their obligations to make loan repayments. This risk can be defined more broadly – as a probability that a commercial portfolio will lose its value, and is generally calculated using the formula below:
Expected Losses = EAD x PD x LGD
Exposure at Default (EAD) is the expected value of the loan at the time of default;
Probability of Default (PD) measures the likelihood that the borrower default;
Loss Given Default (LGD) measures the amount of loss if there is a default, expressed as a percentage of EAD.
The primary purpose of conducting loss analysis is to examine how loan losses affect profit as banks and financial institutions are expected to hold reserves against expected losses, which in turn is considered a cost of doing business. Estimating the main risk factors accurately provides credit risk managers with a foundation for timely and informed decision-making and pricing commercials loans appropriately in accordance to an organisation’s risk appetite.
Protecht recognises the significance of better management and decision-making processes and has embedded comprehensive, yet simple-to-use, business intelligence tools in all of our products. Protecht.CCRM for example, provides credit risk managers the ability to collate borrower financial data and qualitative information and monitor risk profiles through the credit risk grading (CRG) tool as well as conducting migration analysis that highlights changes in the risk profiles.
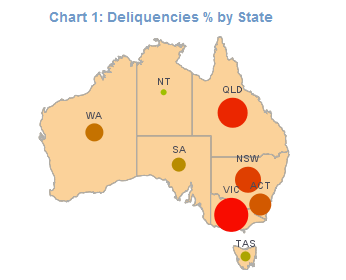
Dashboards and reports can be built in Protecht.CCRM around several key risk dimensions, including non-performing loan analysis, portfolio credit exposure and facilities security analysis. Users can view, for example, delinquencies as a percentage of the total lending portfolio by borrower segment, by product type, by geography in for example a map view (see Chart 1 as an example). In each of these views the user can drill down and see where the potential problems are.

For example, a user might want to drill down into a particular region – Victoria in this case. For one thing, it’s an obvious hot spot on the map, but it also has a high proportion of delinquency of over 90-day past due. Clicking on the map can get the user through to a delinquency analysis report for that particular region, in the report the user can examine the performance of all the business banking products over the last few months and have a look at the delinquent amount for each product per period.
The combination of the various raw risk data into risk intelligence can now allow the user to make informed business decisions around credit risk. This is a simple example but from the demonstration we can see that dashboard integrates all delinquent information in one place and provides users easy and quick access to all risk data and their trends.
In addition to the above-mentioned reporting system, moving from raw risk data into business intelligence can be very useful for banks and financial institutions in terms of forecasting borrower behaviour trend. Based on the historical data, organisations may define characteristics of SMEs who are unlikely to repay the loan and hence reduce credit risk.
Business intelligence can assist you in making better credit risk decisions.

