The primary purpose of risk management is to create and preserve value. Rather than it being a chore or a regulatory demand, risk management should be viewed as central to the organisation and its means of creating a return on capital employed.
The ISO 31000 risk management standard was released in 2009 to assist organisations in embedding risk management into day-to-day operations and to create value through moving beyond from risk measurement and risk anticipation to risk management.
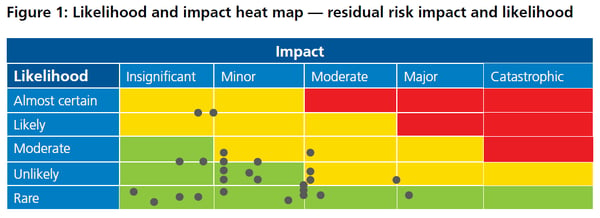
Step 4 of the ISO 31000 risk management process defines the need for risk analysis. At its core, this includes measurements of the relative size of the risks identified. To date, this has primarily focused on the two dimensions of likelihood and the impact.
This ‘measurement’ of risk is then commonly presented on a heat map as such as the one shown in Figure 1, where each dot represents an individual risk.
The primary purpose of such an evaluation is to:
- differentiate between the relative importance of a number of risks
- understand the nature of the risk better, specifically its likelihood of occurrence and its impact if it were to occur
- assist in prioritisation of ‘negative’ risks and the level of mitigation required to bring that risk into a tolerable range and
- assist in the prioritisation of ‘positive’ risks and the level of investment required to generate the positive outcome of that risk occurring.
There is plenty of criticism levelled at this analysis in terms of what it does, and does not tell. This article addresses one of those ‘missing’ pieces and suggests how this analysis may be improved through the addition of the third dimension of risk analysis — the risk velocity.
Two scenarios
Consider the following two risks:
(a) ‘radio jock risk’ — a radio shock jock bad-mouthing our company leading to severe reputational damage
(b) ‘customer behavioural risk’ — customer behavioural change leading to a substantial sales decline.
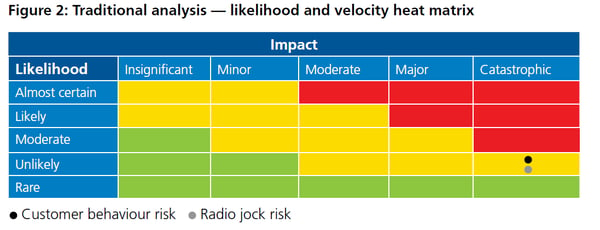
Using the traditional two-factor analysis, we might conclude that both risks have a likelihood of occurrence of ‘unlikely’ and impact of ‘catastrophic’. As a result, both risks would be ranked equal as shown in Figure 2.
Intuitively however, the ‘radio jock’ risk is more likely to keep you awake at night. Why? The answer may lie in the fact that each risk has a different risk ‘velocity’.
Velocity, as defined in physics, is the length of time taken by an object to move between two points, in a given direction. If we apply this to risk, we can potentially interpret risk velocity as either:
(a) the period between the current time and when the risk is next expected to occur? It is the period from now to when the cause will occur. We will call this ‘velocity — time to cause’ (TTC), or
(b) the length of time taken for a risk to move from the initial causes through to experiencing the impacts. We will call this ‘velocity – time to impact’ (TTI).
Both of these characteristics of risk are important and will be addressed separately.
Velocity — time to cause (TTC)
The traditional measure of risk likelihood is commonly articulated in a number of ways such as:
- likely frequency within a given period (for example, ten times per year, once in five years)
- percentage probability of an event ever occurring (for example, 20 per cent)
- percentage probability of an event occurring within a given period (for example, 40 per cent chance in the next year).
If we apply these measures to our two risks, our analysis might be set out as in Table 1.
The first two measures do not take into account an assessment of the time to the first occurrence of the risk so that therefore TTC is not considered.
The last measure ‘probability of event occurring in the next year’ does however consider TTC defined in this way, and it is effectively incorporated into the likelihood assessment. Where the first two measures are used, a separate assessment TTC would need to be considered.
Velocity — time to impact (TTI)
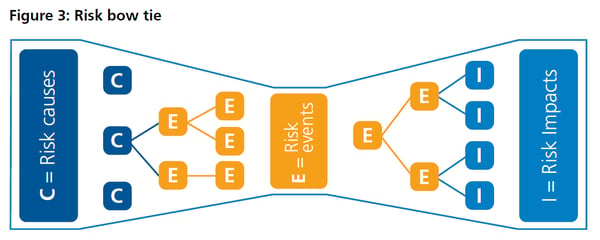
Many risk management practitioners commonly use ‘bow tie analysis’ to illustrate the components and behaviour of different risks.
Figure 3 shows a typical bow tie, which can be used to demonstrate the three stages of a risk developing, from the root cause(s) — ‘C’ — through the various risk events —‘E’ — and finally to the risk impact(s) —‘I’.
TTI is a measure of the speed that a scenario moves from the initial cause(s) ‘C’ to the point where the impact(s) ‘I’ are felt. The ‘radio jock’ risk has a very high TTI while the ‘customer behavioural change’
risk has a very low TTI.
Traditional likelihood and impact analysis will often intuitively factor this characteristic into the assessment of impact by measuring the impact of the high TTI risk greater than for the low TTI risk. This is because less can usually be done to mitigate the impact of a high-velocity TTI risk before it is too late and the impact is felt.
It is clear that there will be a positive correlation between TTI and impact due to the differing time available to take action. The question is then, should TTI be considered as a separate characteristic from likelihood and impact?
Our view is that TTI has become a necessary measurement in the proper management of risk, driven in part by the pervasiveness of social networking (high TTI velocity resulting in rapid reputational impact) and online markets (high TTI velocity due to lower barriers to entry and speed to market of competing products and services). Of course other factors such as rapid regulatory change or introduction of disruptive technology can also have a profound effect on the TTI of a risk.
The risk assessment process now needs to consider, therefore, not just the likelihood and consequence of a risk, but the impact velocity of that risk — the TTI.
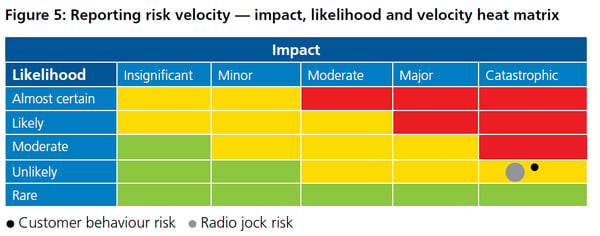
We might then rate TTI for the radio jock risk as very high and for the customer behavioural change risk as very low. This might then be shown, for example as in Figure 5, using the relative size of the risk ‘dot’ to show velocity, a large dot for fast velocity and a small dot for slow velocity.
The measure of a risk’s TTI therefore helps to differentiate risks that may have the same likelihood and consequence but be intuitively different in importance due to differing velocities.
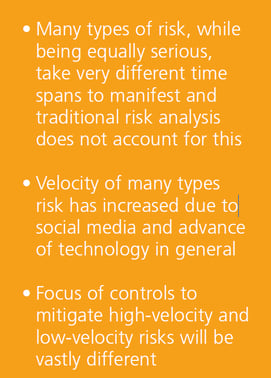
So what does this mean to the evaluation of these two risks? First, it is clear that the radio jock risk can have a quicker impact on the organisation compared to the customer behaviour risk. Second, and more importantly, the focus of control to mitigate these two risks will be vastly different.
In the case of the radio jock risk, focus needs to be on controls to minimise the likelihood of the risk eventuating — if this is at all possible! There is a definite need for high-velocity TTI risks to have a rapid response to mitigate the consequence of the impact. These are your reactive controls. For example, the reputational damage to an airline of a severe incident (such as Qantas with the A380 incident in Singapore several years ago) needs to be detected and mitigated (using reactive controls) as soon as possible after the event.
A high-velocity TTI risk may indicate the need to have a well thought-out crisis management plan in place to reduce the consequence of such a risk event.
The customer behaviour risk is a much slower velocity TTI risk. The focus here is again on detection that a change is occurring and putting in place preventative controls that will stop or at least slow down the TTI risk. This is where using leading key risk indicators can assist greatly.
Key risk indicators and risk velocity
Key risk indicators (KRIs) are observable factors which behave as an indicator of some aspect of risk. Leading KRIs are used to detect measurable changes in risk causes which could indicate that a risk event may occur in the future. Lagging KRIs are used to detect that a risk event has already occurred and that there may be an impact coming.
With low-velocity TTI risks, such as changes in customer behaviour, having trend analysis reports relating to the causes of the risk can assist in detecting that something may be amiss and action should be considered.
Similarly, with high-velocity TTI risks, detection of risk events having occurred coupled with detection of the
consequences can assist in determining the type of response required to limit the consequences of the risk events.
Time to recover velocity
The concept of risk velocity can be taken even further than in the risk assessment process. Unfortunately (or fortunately for positive risks), risk events do occur and a response may need to be taken to recover from the event.
Is there also a need to recognise the time it takes to recover from a risk incident and measure the time to recover (TTR) velocity? In some instances, we believe yes.
Returning to our radio jock risk, recovery from reputational damage can be brought about by direct action involving social media to get ‘in front’ of the event. Alternatively, using the courts to litigate or force an apology could also be an option. Both are valid responses, but which one has a faster TTR velocity? The direct action via social media is probably the answer.
This was the immediate response of Qantas with the A380 incident and they were able to quickly allay fears of the general public and their travelling clients. TTR can also be used to assist in decision-making
around business recovery planning and the development of business resilience strategies.
Concluding comment
Risk is a full-bodied presence in the boardroom and across the executive management team. Risk management is now recognised as being an element of business management that drives the achievement of objectives.
The old ways of measuring risk are behind us. It’s time to stop thinking about risk in its traditional two-dimensional manner. It’s time to move to considering the third dimension of risk measurement: risk velocity.

