Risk is always in motion - its measurement is forever changing. In this webinar, David Tattam and David Bergmark talk about how using dynamic reporting can help you take better decisions in your organisation by bringing all the information that you have around a particular risk together into a simple dashboard.
Video Transcription:
Keith Davies:
Okay, good morning everyone, thank you for registering for this RiskInMotion webinar. My name is Keith Davies. I am Director of Sales and Operations here in the U.K. Some housekeeping introductions before we begin. So a few words about us.
Protecht Group is a leader in enterprise risk management software and services helping risk managers around the world improve company performance through better risk management.
Since 1999 we have delivered training advisory and software solutions that really intensify the risk management focus and discipline both corporations and government departments.
This year we have commenced our expansion into the U.K. and European markets with our ERM system. We are fairly confident that we compete on both price and functionality.
So your presenters today, I am pleased to have the two founding partners, David Tattam and David Bergmark joining us. Still are both as passionate about risk management as ever.
The webinar will run for around 35 minutes, we'll leave 10 minutes for questions at the end. You can post a question at any time. Just enter your question in the question section on the go to control panel. If the question input area isn't visible then click on the orange arrow at the top of the panel to expand the viewing area. We will respond to the questions at the end of the presentation. If there are any that we don't get round to we will respond to those by mail within the next 24 hours. Recording of the webinar will be made available to the registered participants. If you would kindly complete the short survey at the end it will be very much appreciated.
Now I will hand over to you, David.
Demystifying RiskInMotion
David Tattam:
Thank you Keith, really appreciate it. So what exactly is RiskInMotion? The RiskInMotion concept reflects the dynamic nature of risk and is aimed at providing a more continuous, comprehensive up to date in realtime view of each key risk by consolidating all the available information we have about that risk, such as:
and the like, and displays that information for each key risk on a continual consolidated basis.
One of my passions is riding motor bikes. Any rider will know that risks while riding a motor bike are very dynamic. They are always changing. While you are riding you always need to be alert and always monitoring what is going on around you in the environment, and also what is going on with the bike.
If I reflect on traditional business risk management we often see the periodic risk assessment. We have the period end report, often a five by five matrix, often delivered several days or even weeks after the period ends. I feel this is like riding a motor bike with a blindfold on, or at best riding while looking in the rear view mirrors.
The main issues with current risk assessment reporting that we see is really that they are static and out of date before their information is even received. They are often updated infrequently. They are very subjective and short of objective information. Often only one aspect of the risk is shown, such as a traffic light report based on likelihood of impact. A lot of other relevant information about that risk is often not connected and is viewed separately.
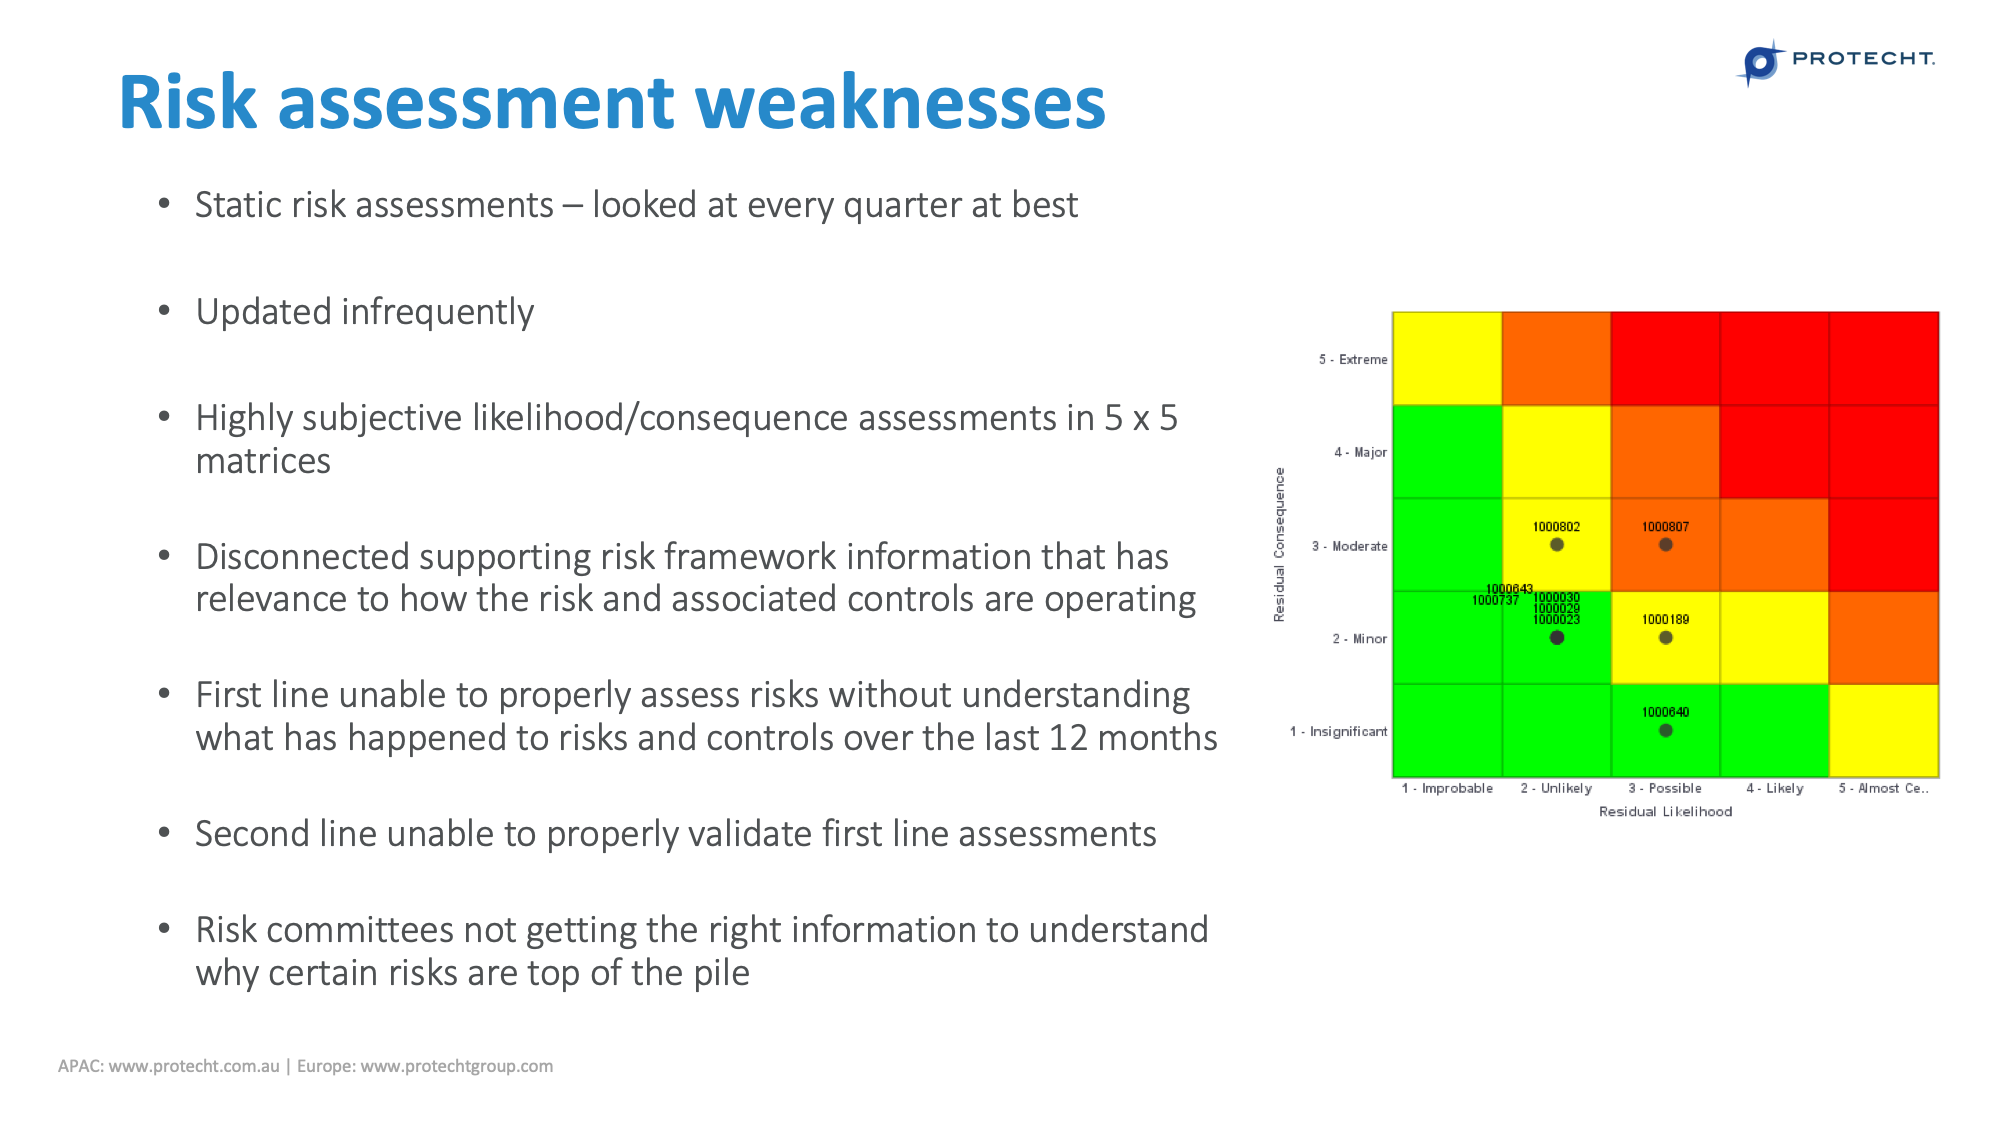
And lastly, we are not really giving the user, be to line 1, line 2, line 3, the information they need to make timely decisions, provide timely assurance and gain relevant insights into the risks and issues on a timely and frequent basis.
So the bottom line is risk is dynamic, it is not static, it is always in motion. This brings us to this webinar.
How can we capture all the key elements of risk and provide a more real time dynamic fluid view, and give it the best picture of the risk at any one time?
The information we generally look at collecting includes risk assessment, controls assurance and testing of those controls. Control attestation, whether the person who operates the control has done them. Key risk indicators, key control indicators, key performance indicators, information about actual risk incidents that have occurred. Issues and actions outstanding around that risk and I guess last but no least, audit ratings of controls.
This information is used immediately. It is available in RiskInMotion. The output of RiskInMotion is therefore a business equivalent of the view from inside of a crash helmet while you ride. The summary of the available current information which is more fluid. Information over each risk, so that we are able to deal with issues whilst they arise on a much more timely basis and provide assurance where risk is being managed well.
This will include watching the trend to identify such things as, are incidents for a given risk increasing or decreasing? Are control testing results improving or getting worse? Are internal audit findings being closed or left open for excessive periods of time? And I guess also, how many metrics are outside of their tolerance level? Just some of the information we could look at. This could then provide maybe a lead table of risk based on its overall score derived from all of that available information.
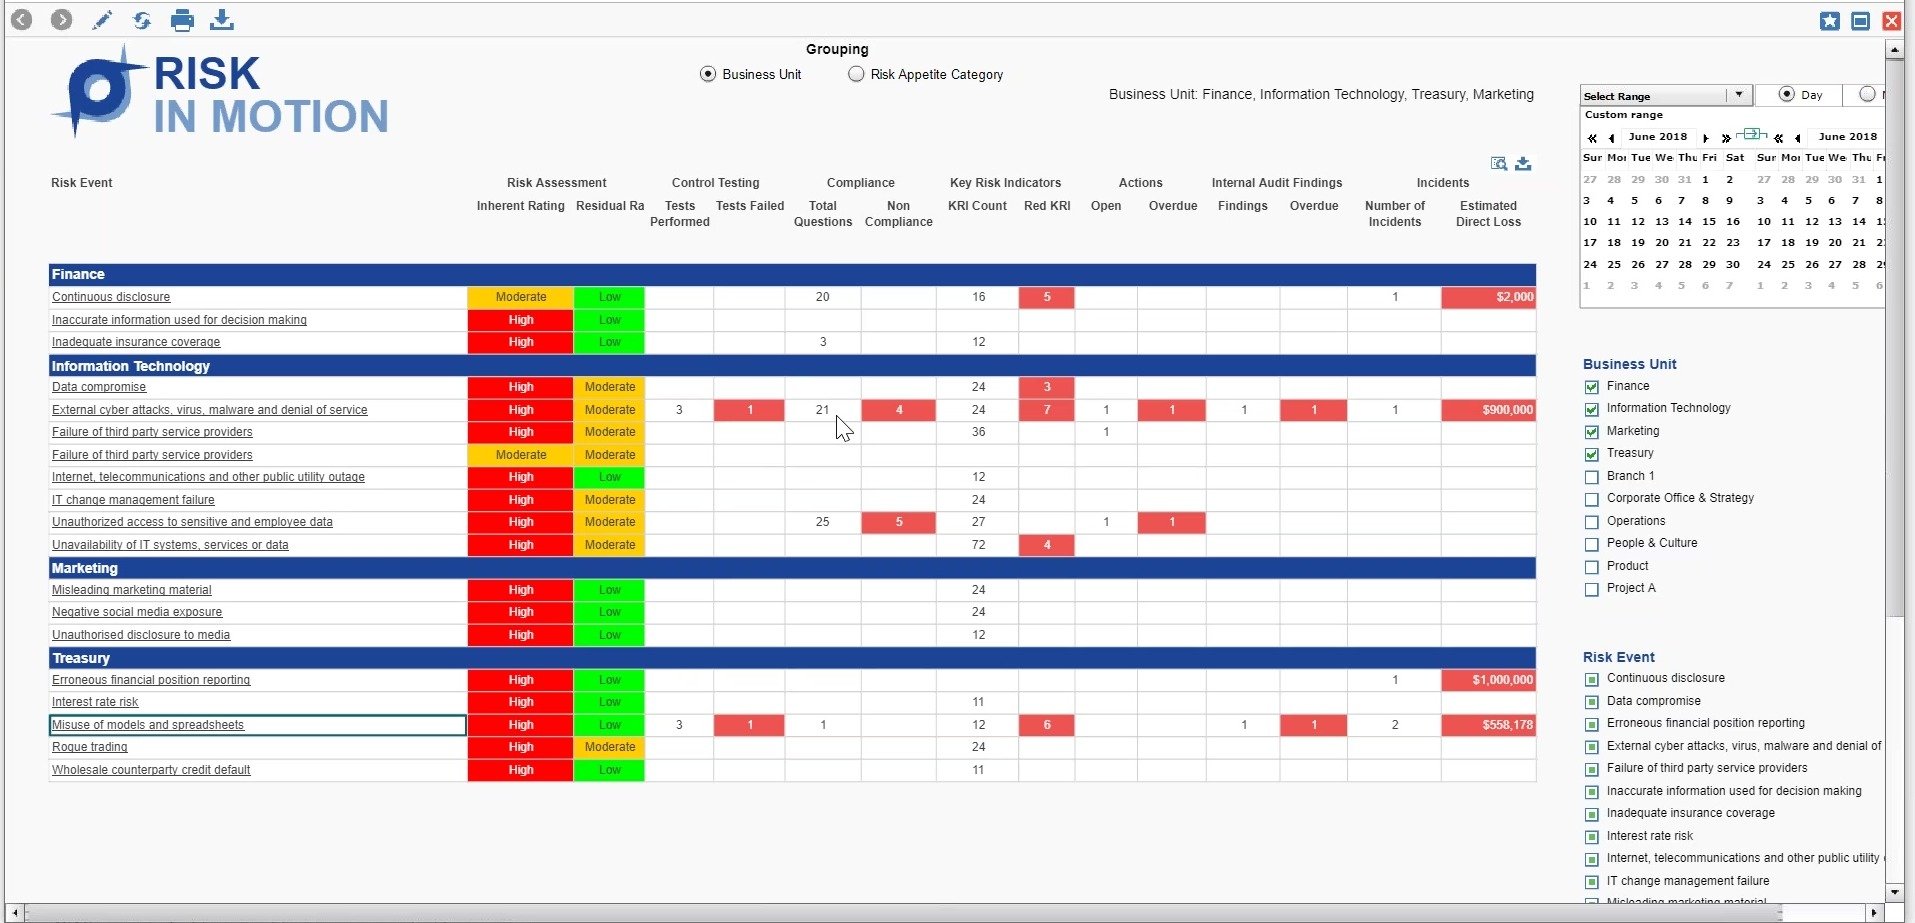
So I guess this may all look and sound nice, but really so what? We think about the use of this.
- Firstly, for the first line, the first line will have much more real time, or much more information on a real time basis. So they can understand their risks and related issues. This could be facts in day to day decision making and actually be used in running the business rather than just watching the business after the event. The information can be more objective. The dashboard of a motor cycle is not just a once a year condition report of the bike, but an up to date view of all the risks you face as you ride.
- For the second line there is more information that is available to review and challenge, again on a more timely basis. The information for review is much more comprehensive and allows continue review and continuous challenge.
- And last but not least, the third line. Audit will now be able to target their reviews on a more dynamic risk basis so it will allow targeting their efforts to the places that really matter.
So I now pass over to my colleague, David Bergmark, to show you a more in depth and practical view of RiskInMotion. So Dave.
Making your Risk Assessment more efficient
David Bergmark:
Thanks Dave, much appreciated. So just before we hop in to have a look at the product and how it connects that information, probably just a bit of background about Protecht.ERM. We kicked off with that in 2002, and we went to offer as a service day one back then. After a little bit of, how would I say, watching what was happening in the GRC space we realised that we needed to embed some flexible form technology, which really allowed clients to build their own forms to capture any information that they are interested in in relation to the risk framework. But not only create those forms but connect them back to central libraries such as the risk event library in the control library.
That lead to an explosion of the use of the product for various forms and data being captured, so we needed to embed a BI engine into the product to allow great visualisation of that data. Then in 2013 the concept of that RiskInMotion was born, where it aggregated all of that connected information and plotted it up against the risk profile that Dave has introduced us to.
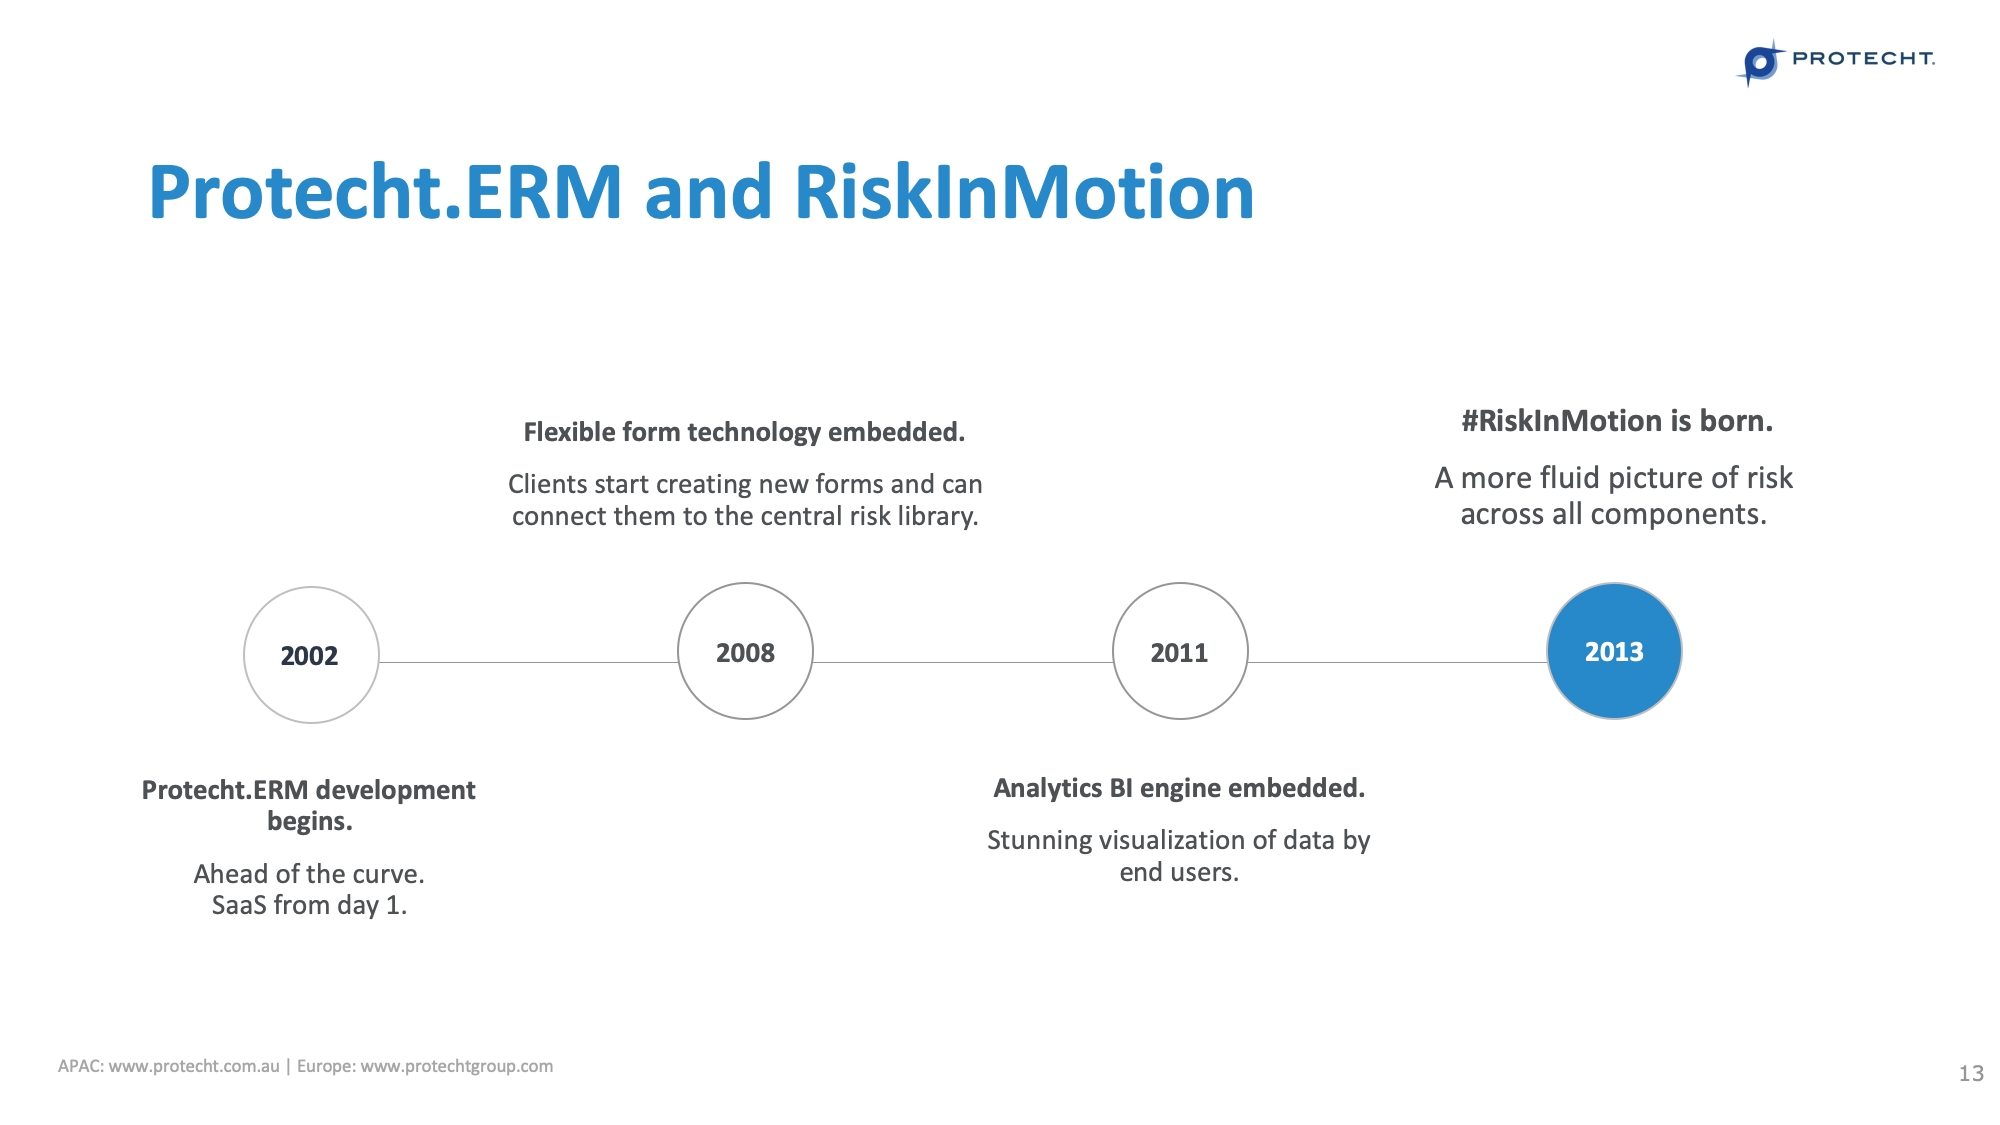
Roll forward to 2019, the ERM application now covers all of those components that David introduced us to, but also other areas such as EHS, BCP and certainly in the U.K. the SMR regime.
So what I would like to do now I'll hope into the product to have a look. I am going to go in as an administrator, 2nd line administrator, so I am going to have access to the full menu suite. Before we get into that menu suite just a quick discussion on the launchpad that each particular role would see. Because I am 2nd line I am interested in what are the key components to the framework that I would like to keep an eye on as I log into the system each day. So I've obviously got the residual risk assessments and current risk profile up at the top.
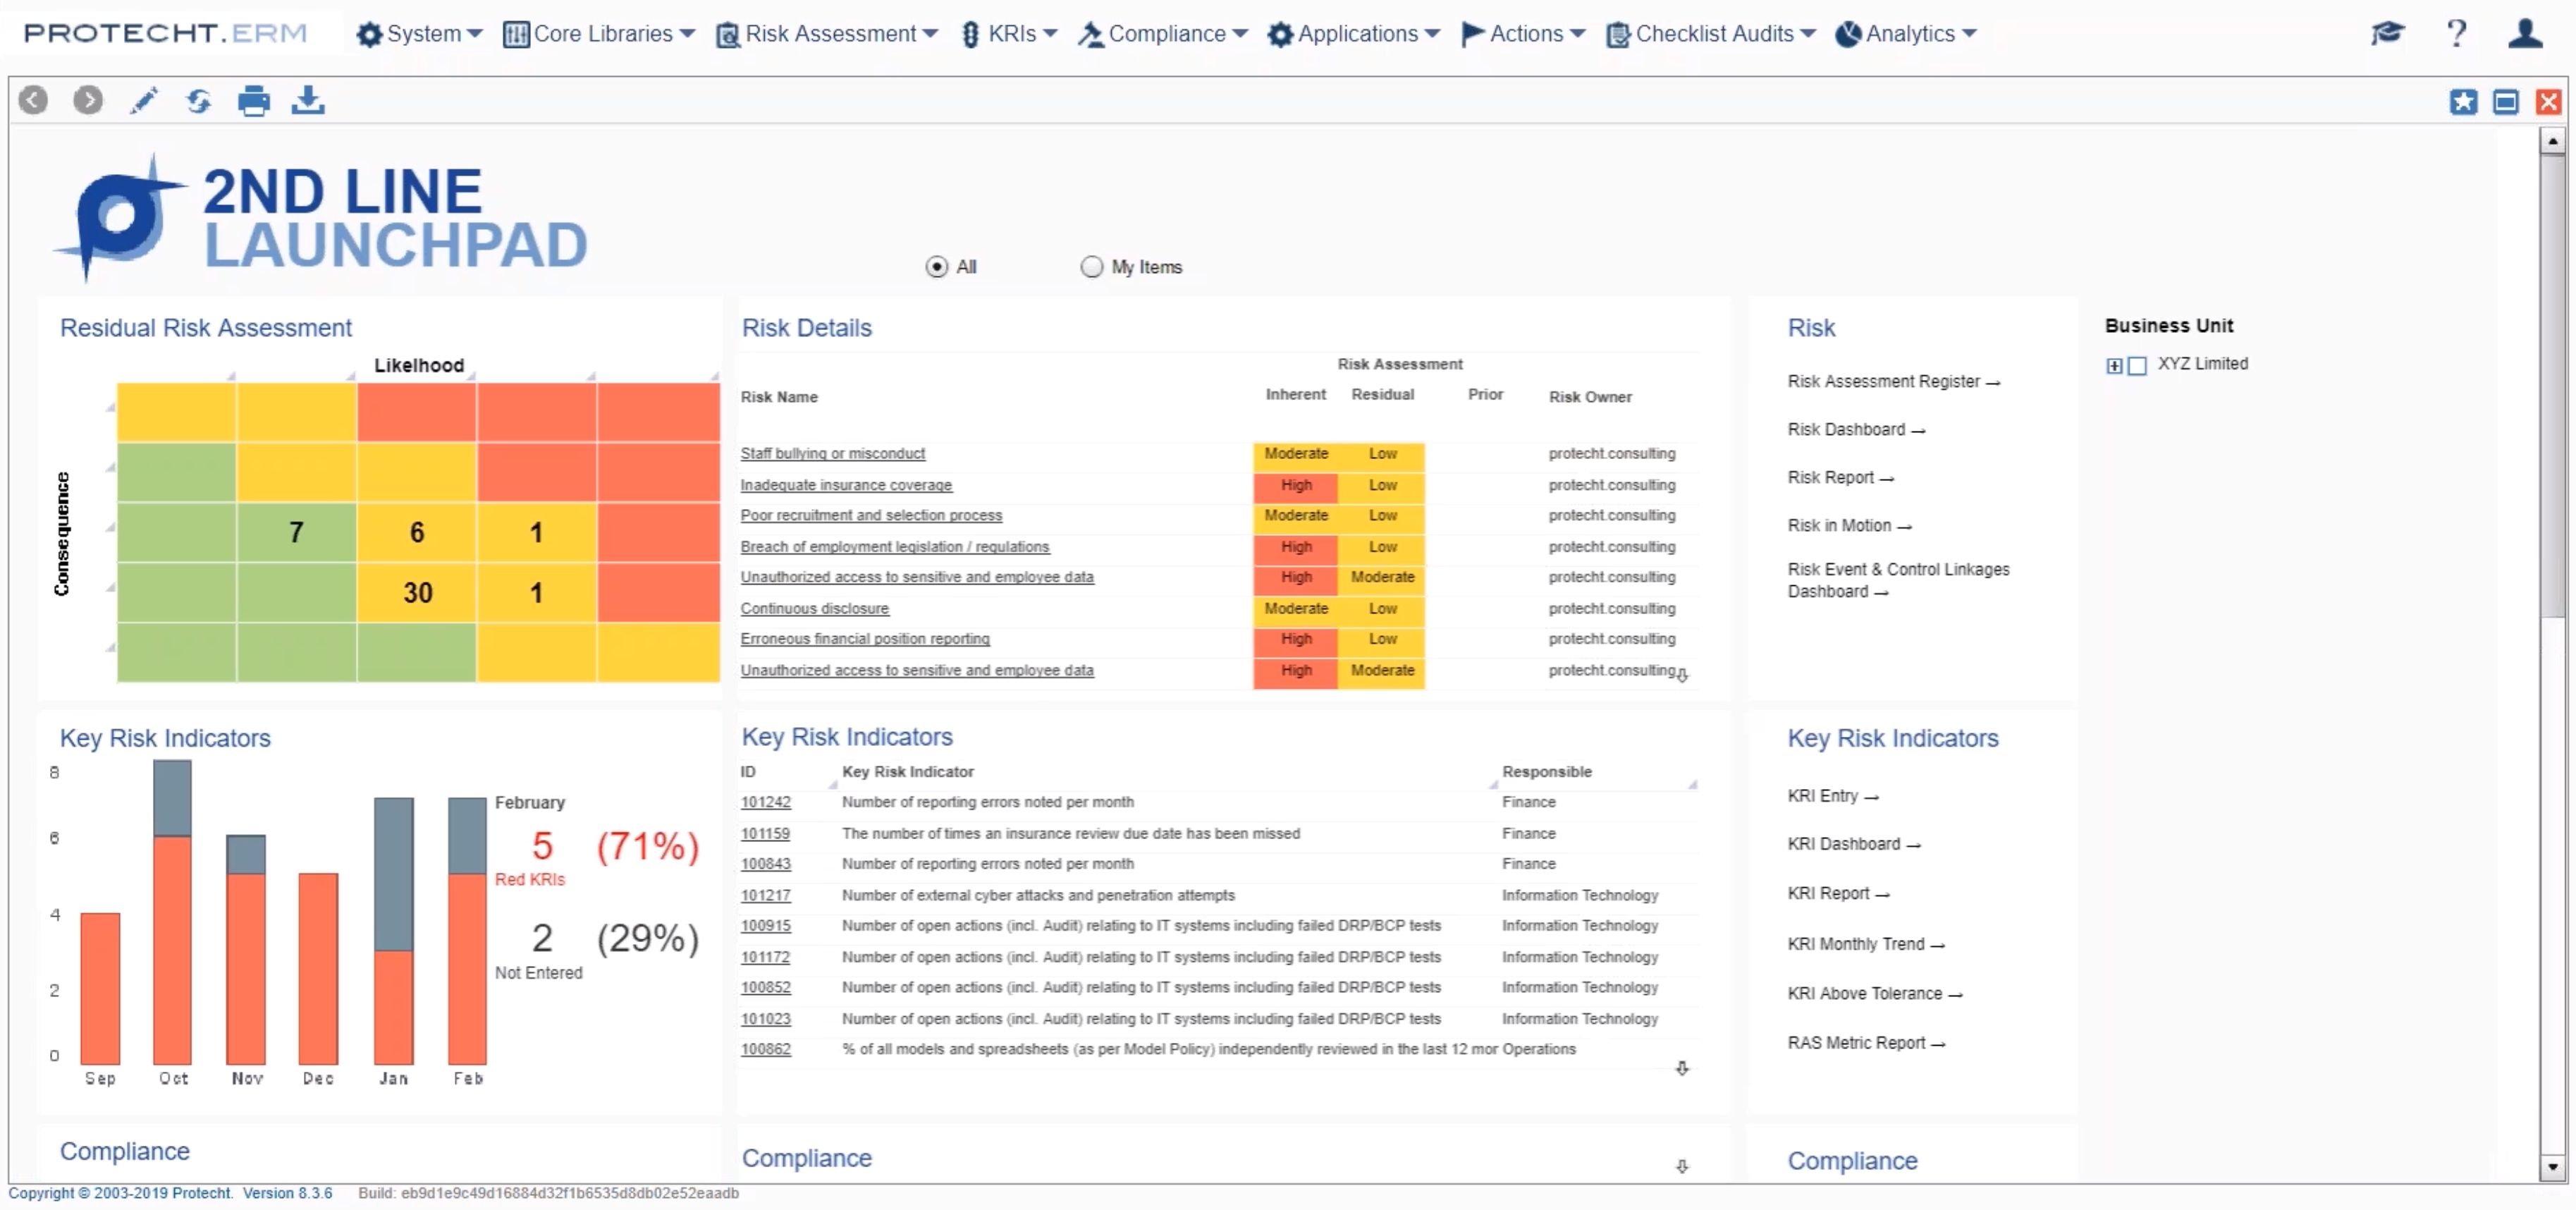
If I move down that launchpad I will have key risk indicators, compliance, attestations, incidents and various actions or treatment plans that are connected to the various components of the product.
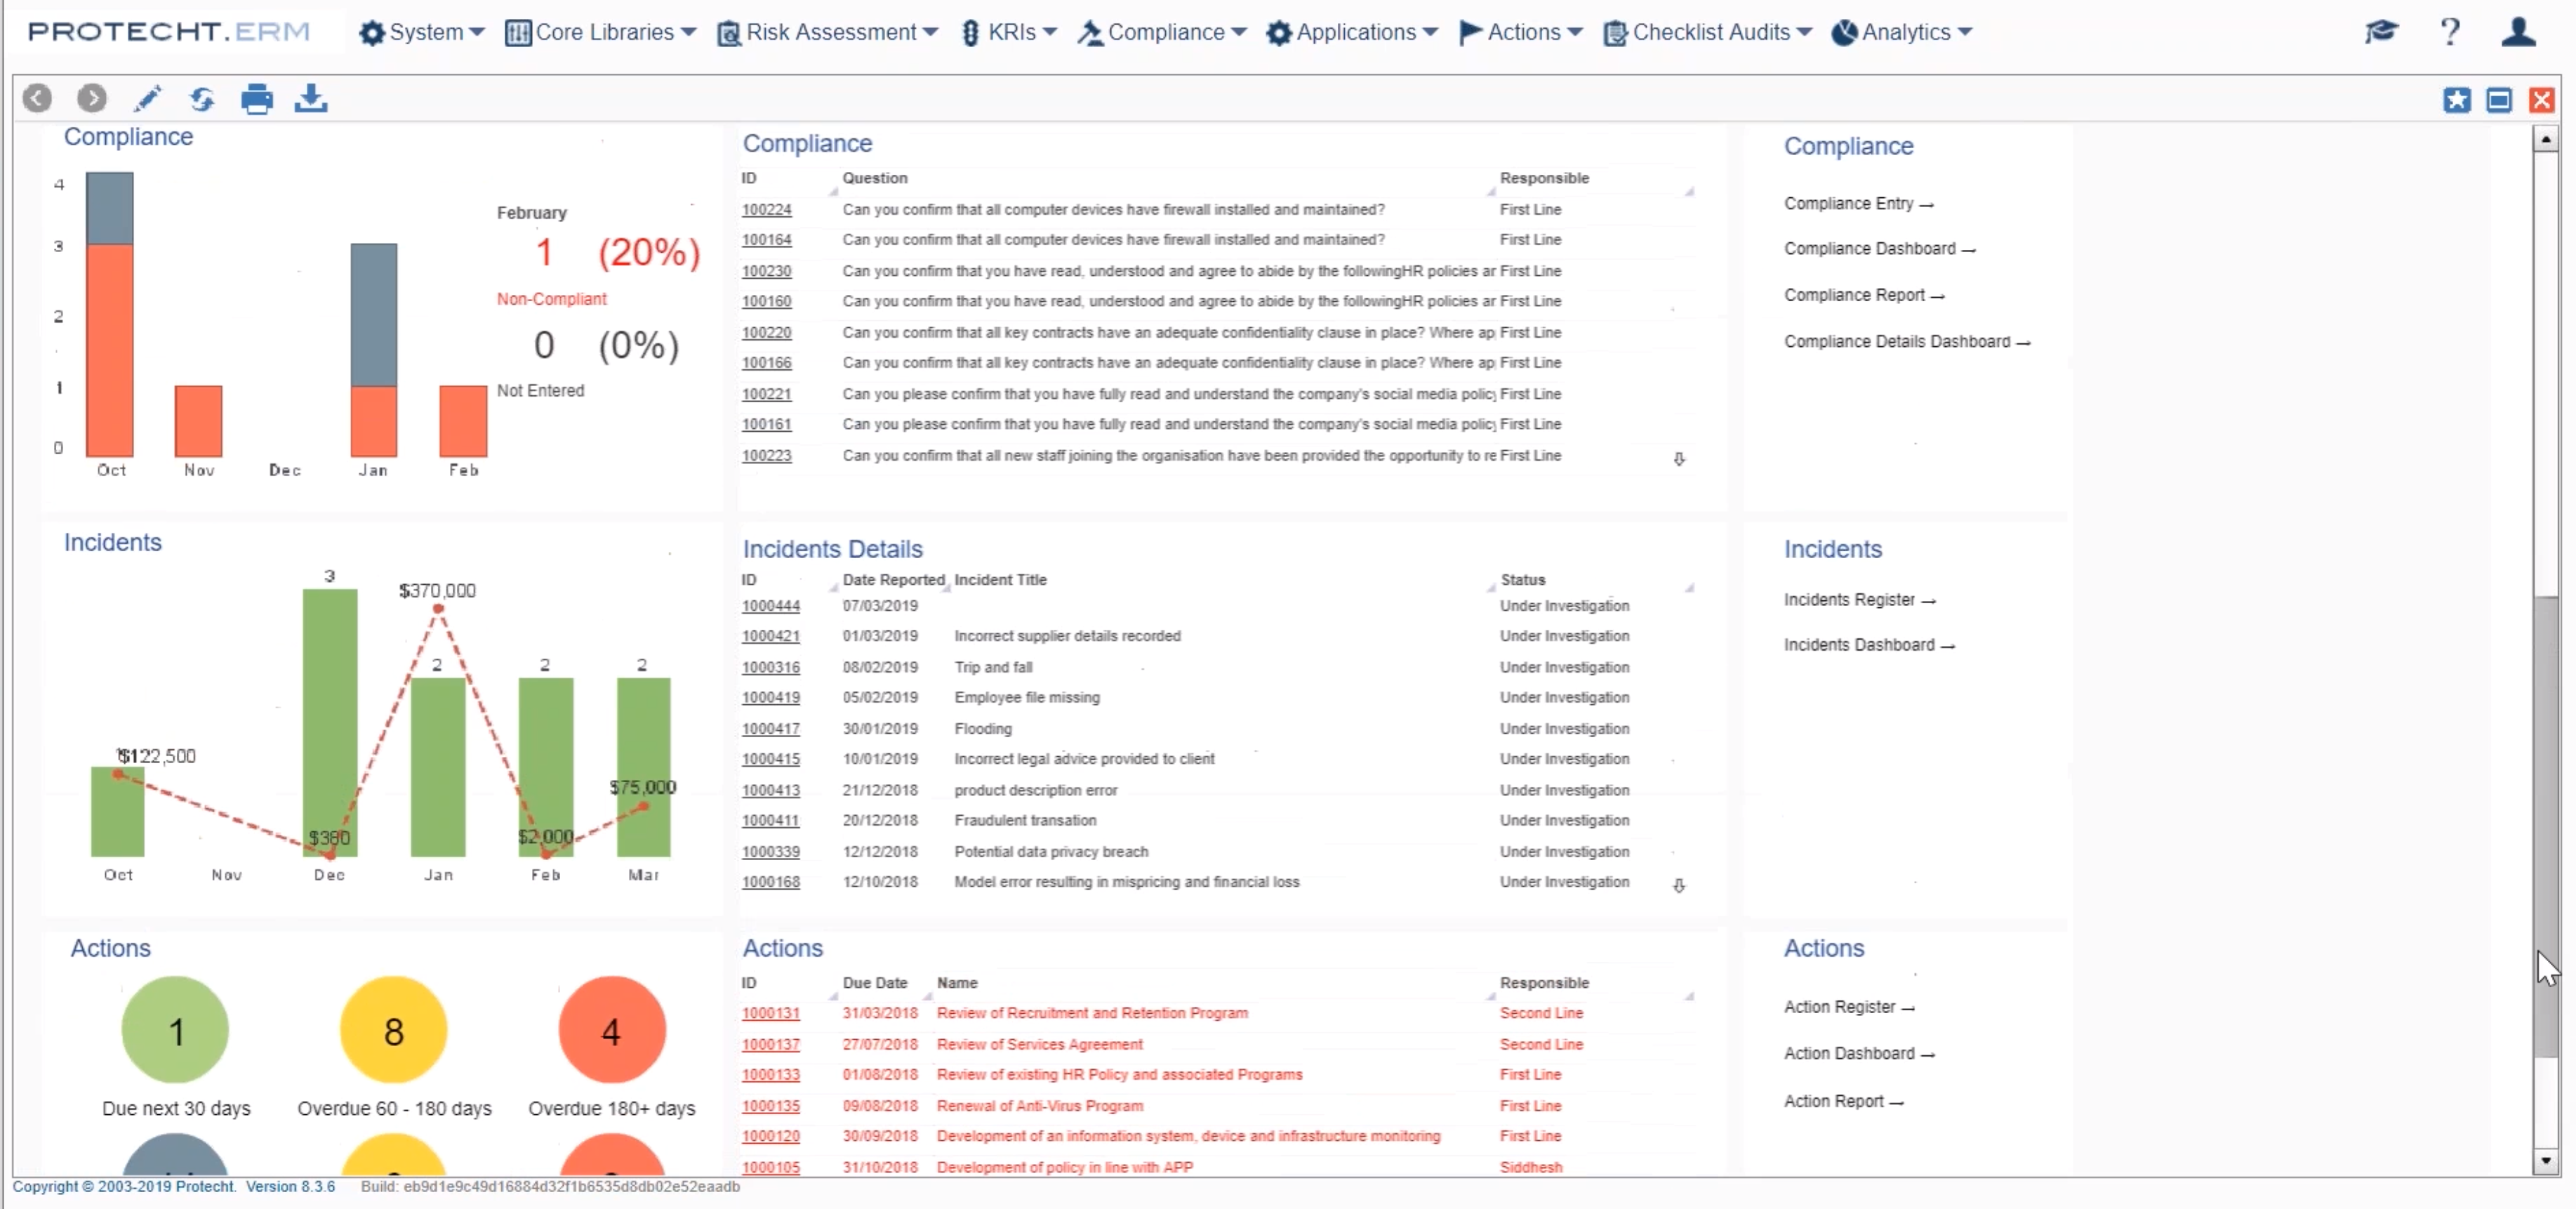
So those concepts are short sharp graphs, utilisation of key data. Task lists for me to look at. But you will notice over on the right I also have hyperlinks to additional reporting. If I click on that RiskInMotion it will take me through to another tab. Then really looks at the concept that Dave articulated in the first part of his presentation, where we look at the risk profile in a one dimensional table rather than the five by five matrix that are traditionally presented. We still have the inherent and residual risk rating, but you can see the other components connected and aggregated up against a risk profile.
I will come back to this shortly. I think it is important to understand how we actually get data in to produce this type of dashboard. And then once we get to understand that we will come back to this and discuss this in a bit more detail.
So coming back to the application, key concepts for production of RiskInMotion is firstly starting with central libraries. You can see we have core libraries of basic information around divisional units, divisional structure, users, risks, controls and obviously causes.
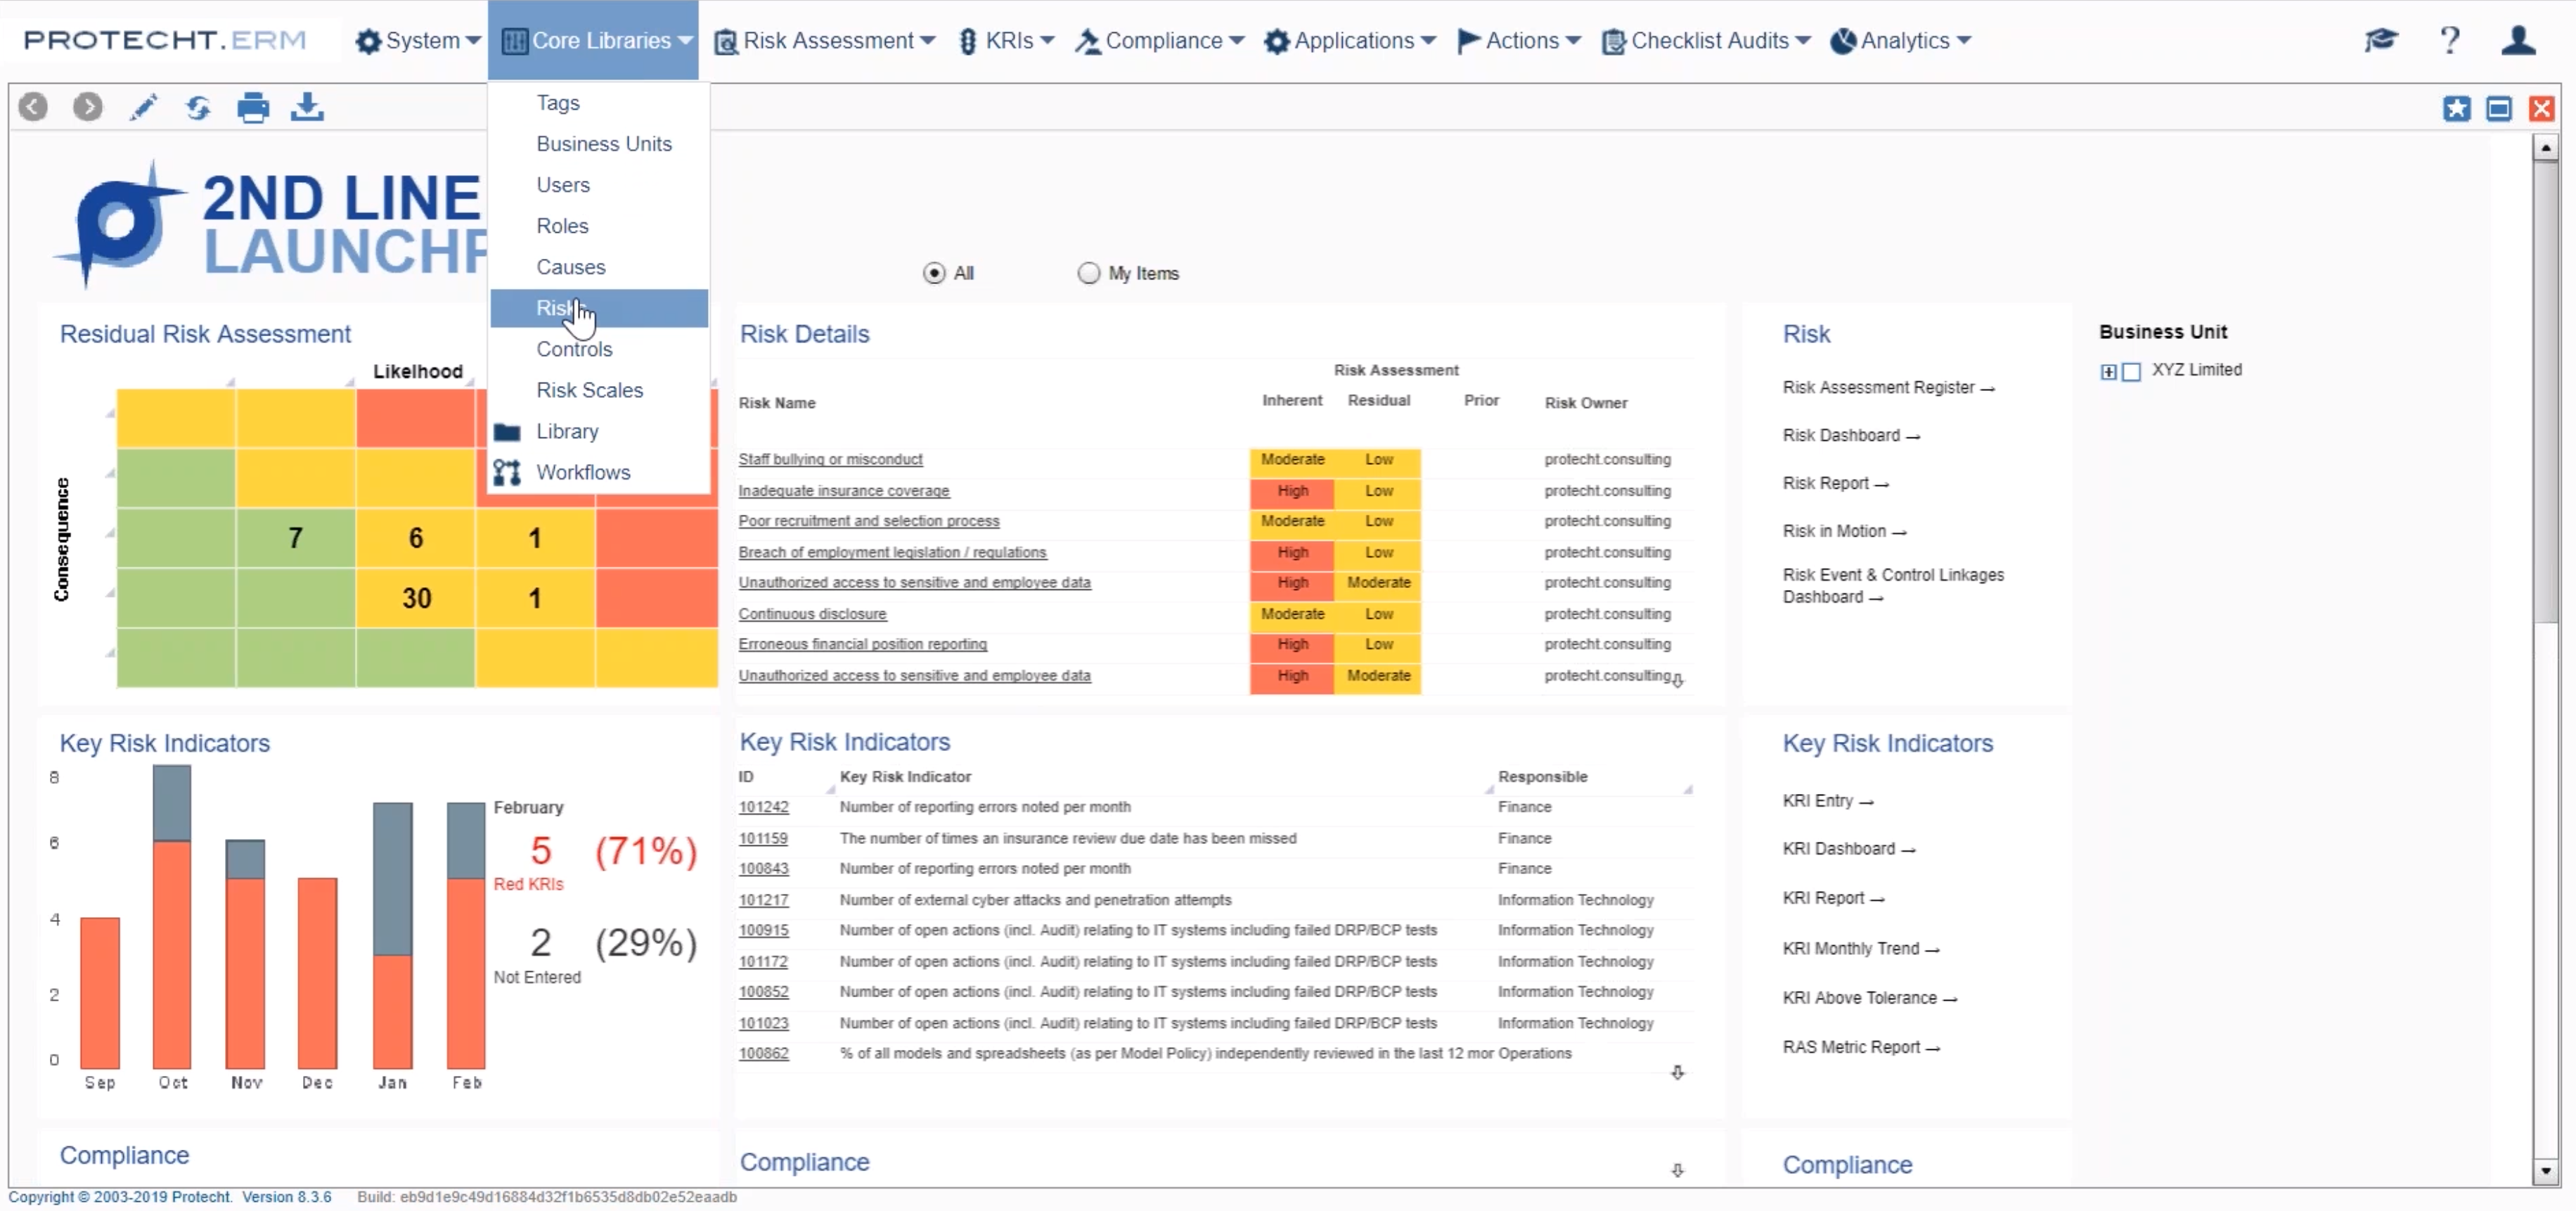
I will probably just focus on the risk library today because I am conscious of the short time for this webinar. If we look at that one library for the risk library, you will see that we are not really doing anything with the risks in this library at the moment. We are just building up a library that we can then reference across the other components of what I believe to be the core components of an enterprise risk management framework, which is risk assessment, continual monitoring through key risk indicators, compliance activities and then applications such as incidents, internal audit, BCP, EHS or WHS.
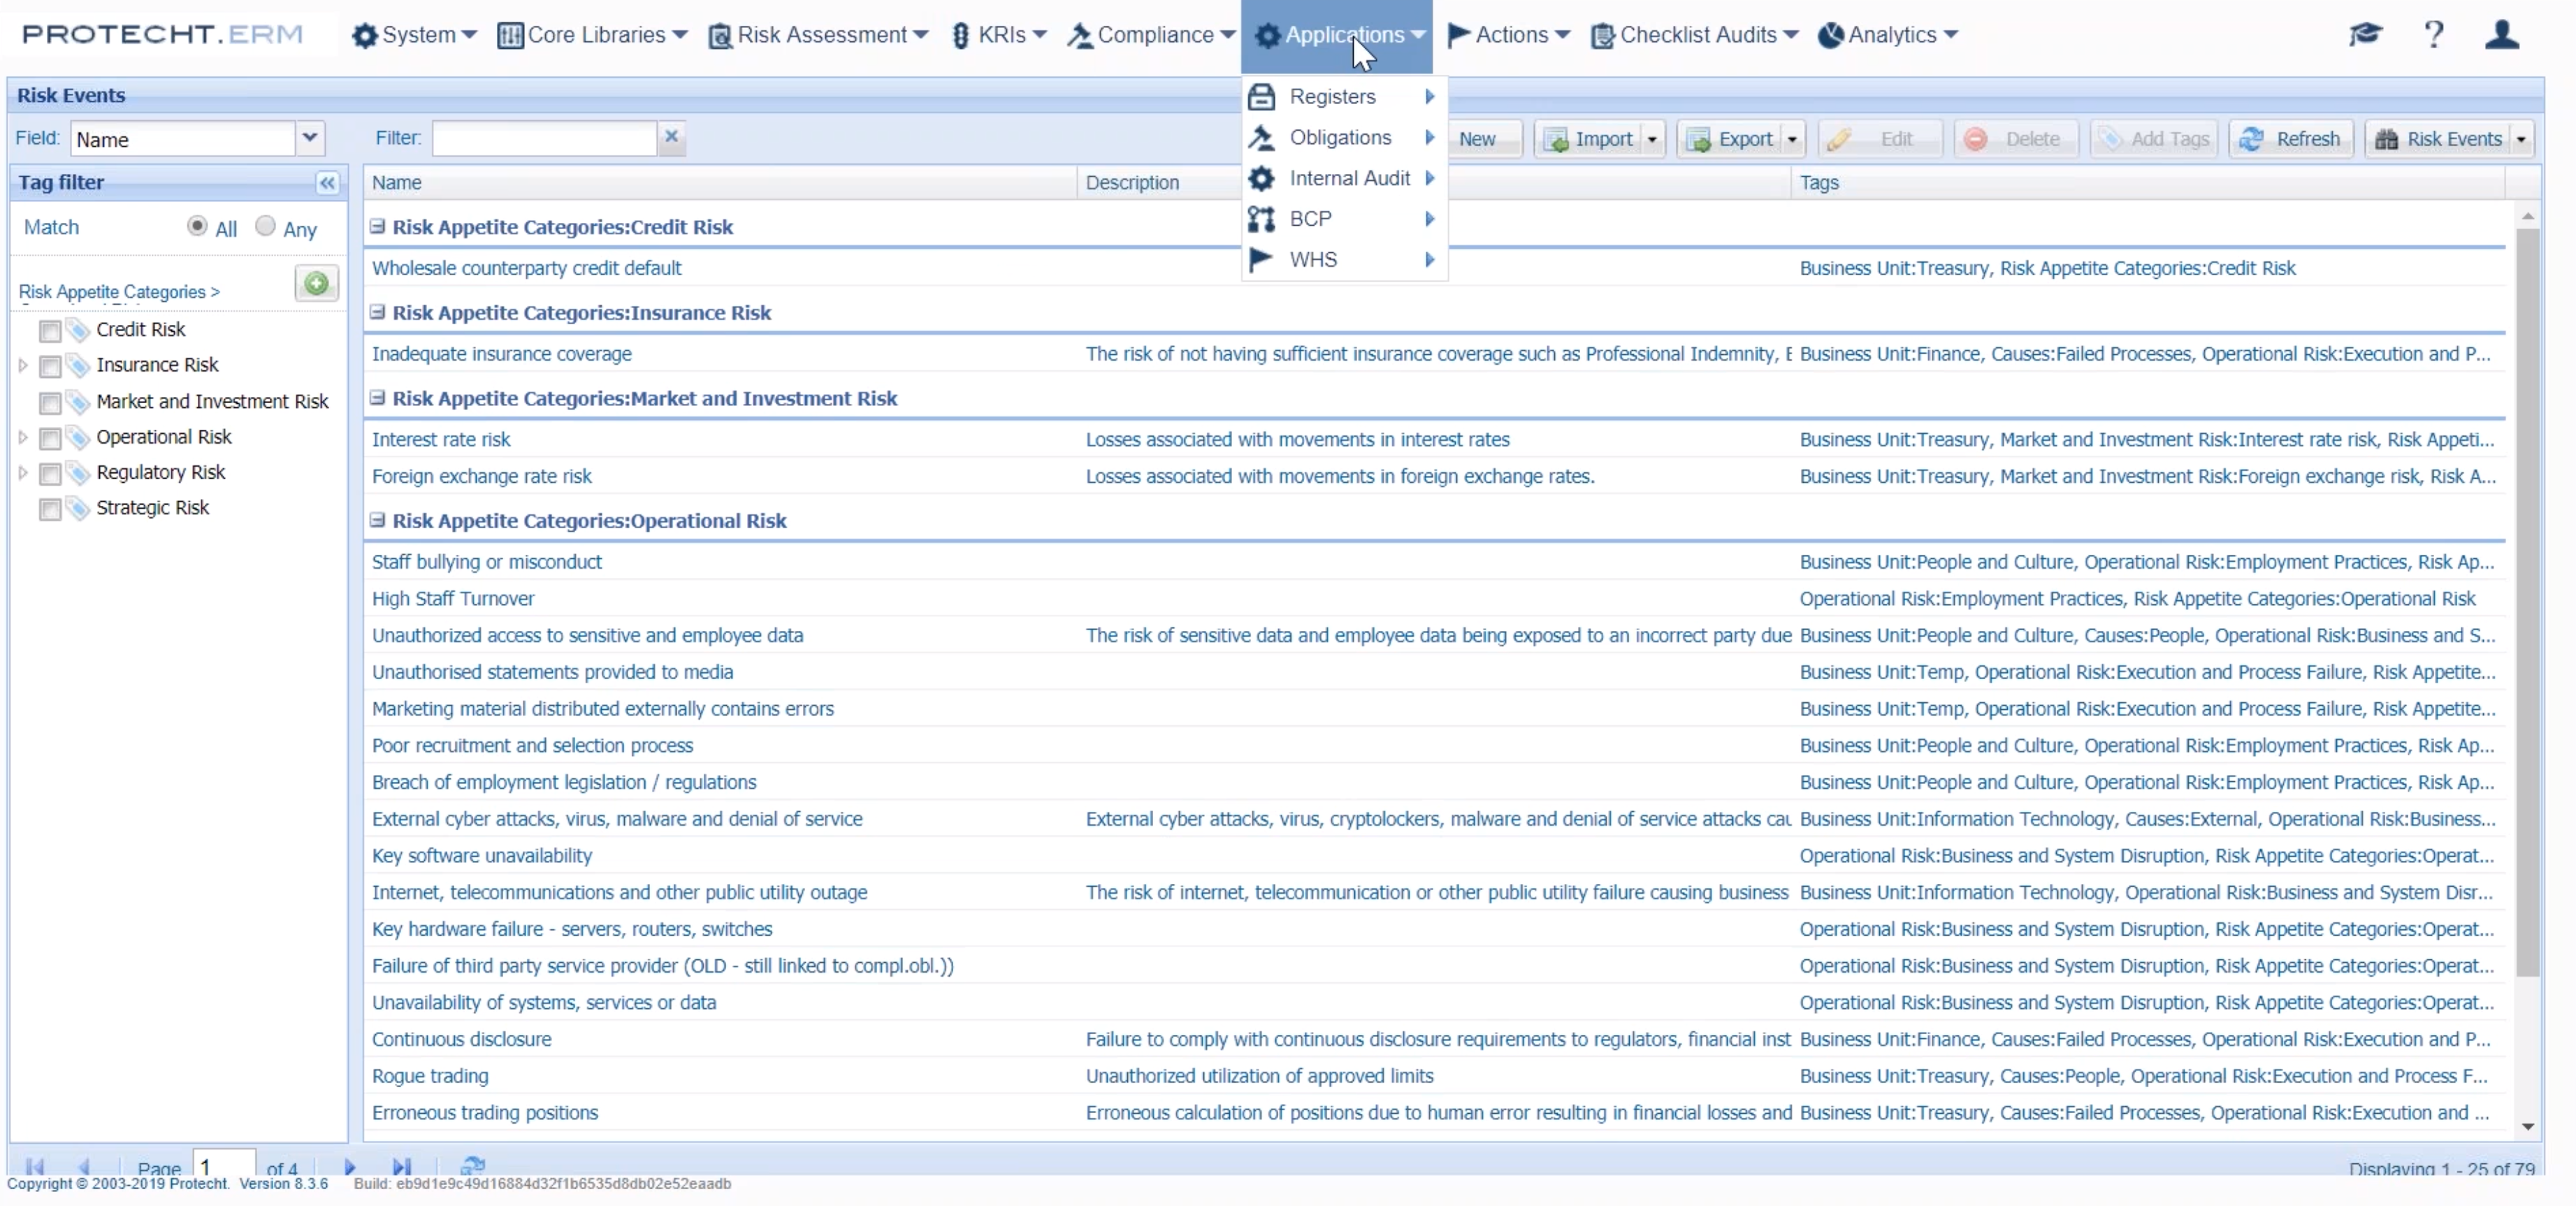
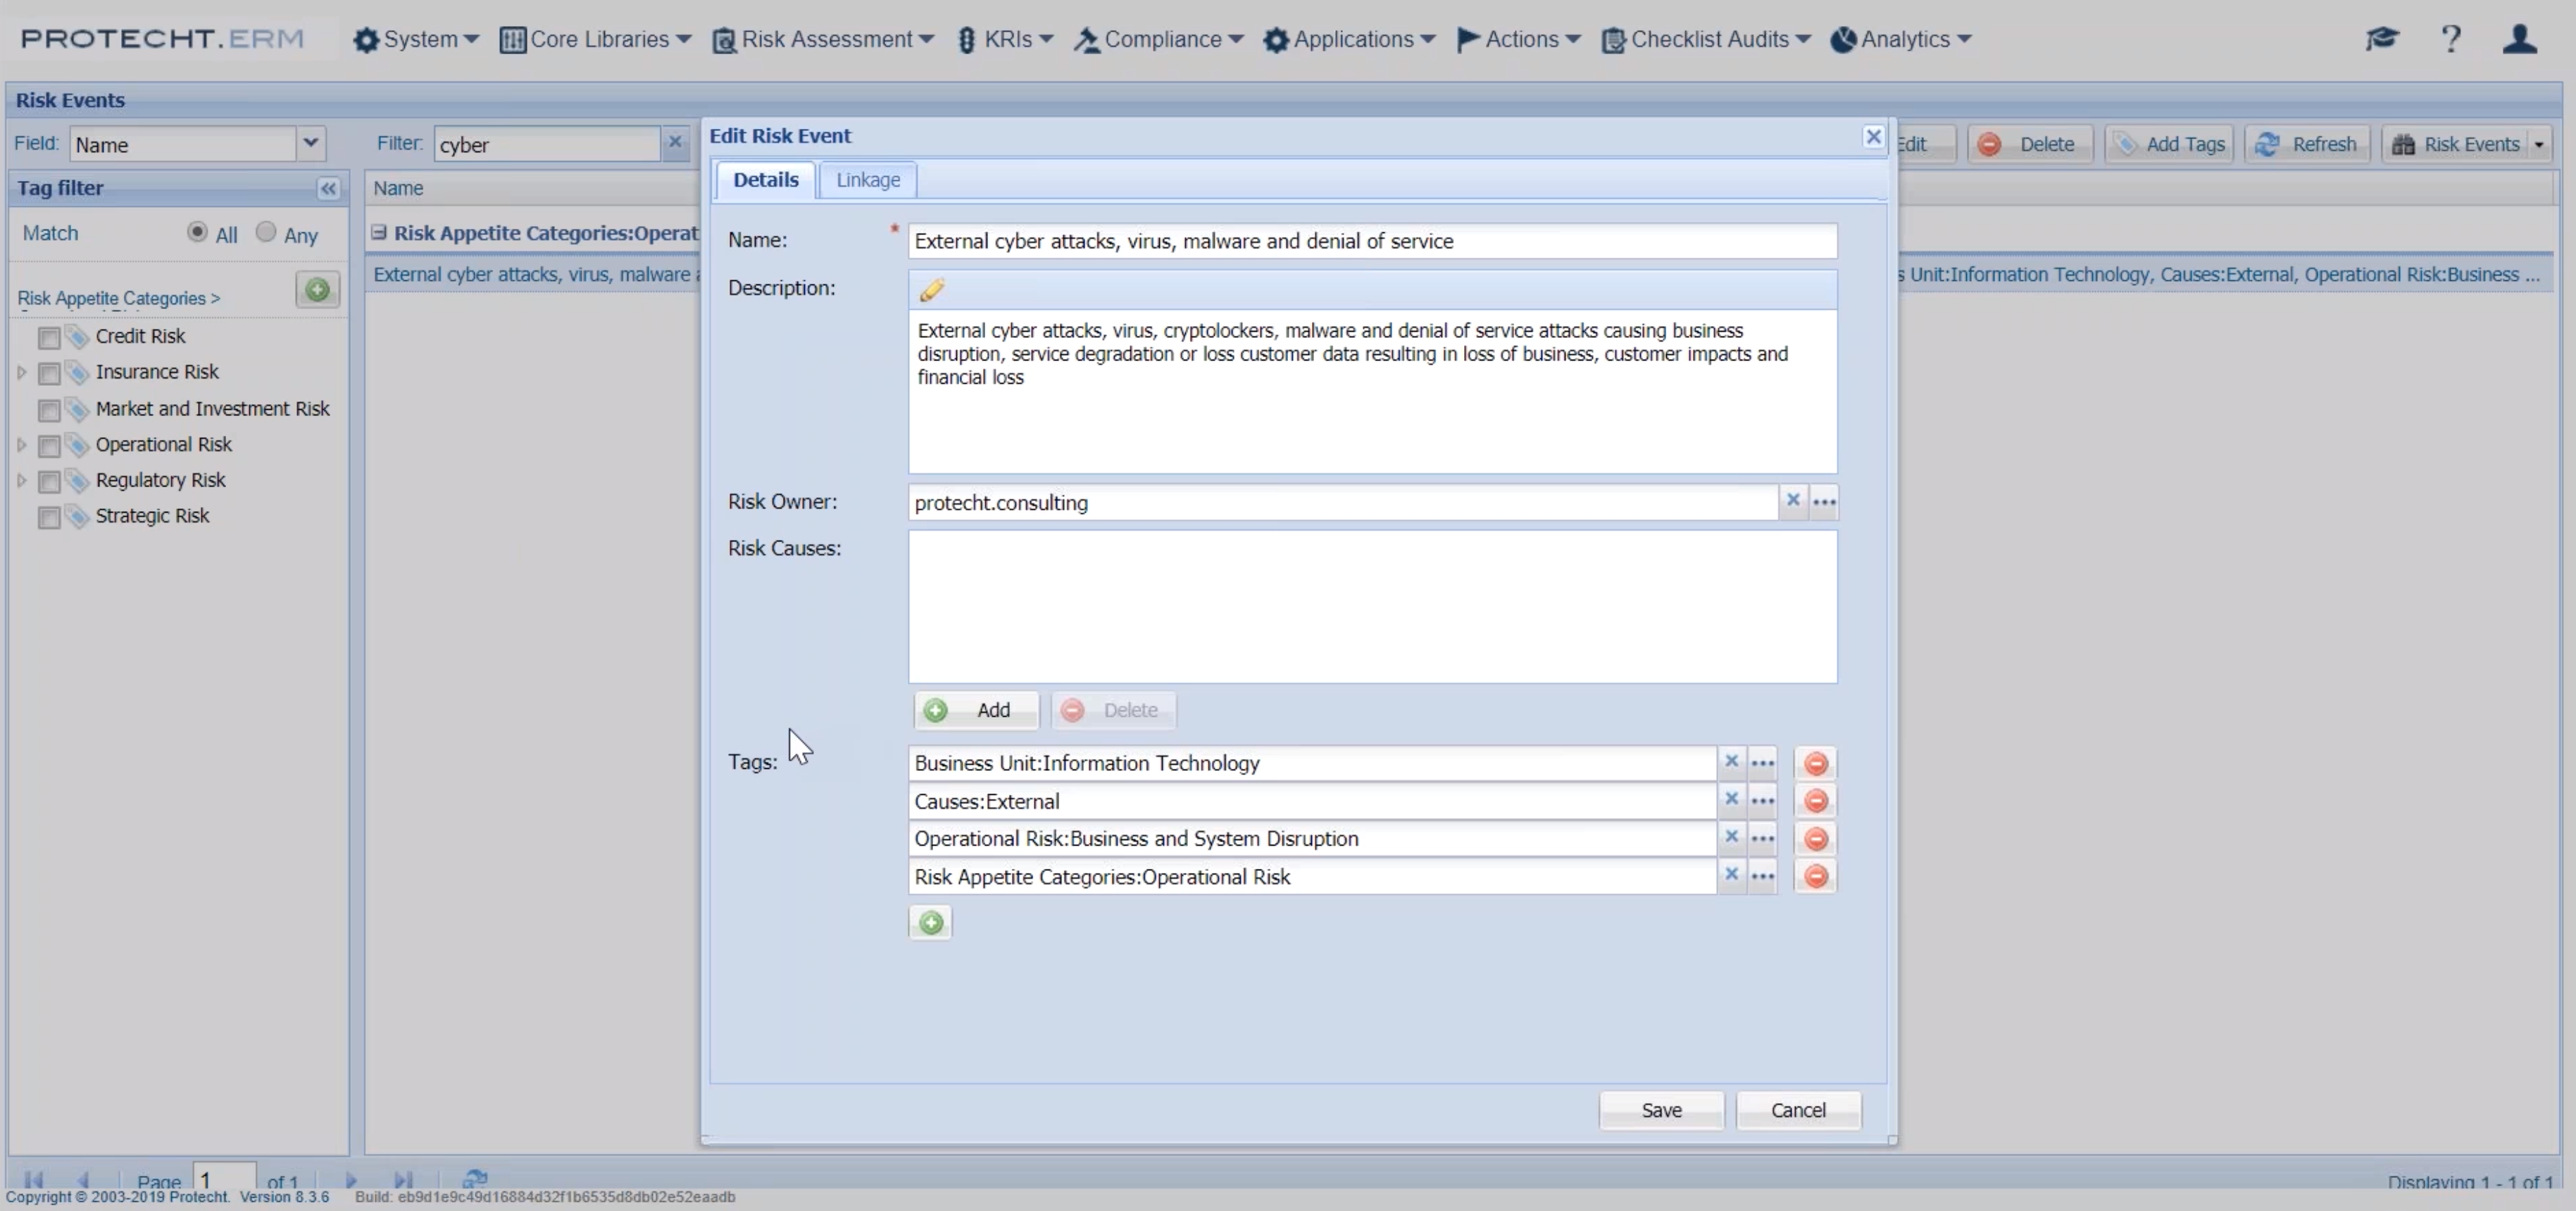
This library is really just that reference library for key risks. If we look at a particular risk we might call it something like, we will deal with Cyber risks, really topical at the moment. If I click on that particular risk fairly basic concept for creating that in the library. We have the name of the risk, description, any owner and then more importantly, the key tags.
For this product we allow classification of the risk in multiple dimensions so obviously we have got a risk appetite classification sub of risk classification and then also something like a business unit to help us sort those risks by particular business units within the organisation.
In this example I filtered by risk appetite, or I've grouped by risk appetite categories, but if I wanted to have a look at a particular business unit grouping we have got the ability to group those risks by that particular generic business unit. These libraries are available for clients to cross reference if required.
Once the risks have been created in the library, it's then a case of being able to reference them in the various forms. So if we look at the beginning of the risk life cycle we can go into something like the risk assessment form. You can see when I click on a particular form it will open up a preview of the records that have been entered into that particular form, and because I'm an administrator I am seeing all of the groups risks that have been assessed. If I was to log in as, say the treasury area or sales and contact, I would only see my particular profile.
If we are working with the cyber risk example today I can look at that particular cyber risk. Sorry, just need to move that GoTo session. Then you can see for that particular form I have the inherent risk, in this example we assess the inherent risk control effectiveness to a rather residual risk position. So pretty standard concept here, I've got the risk description, I can connect it to either strategy or group risk.
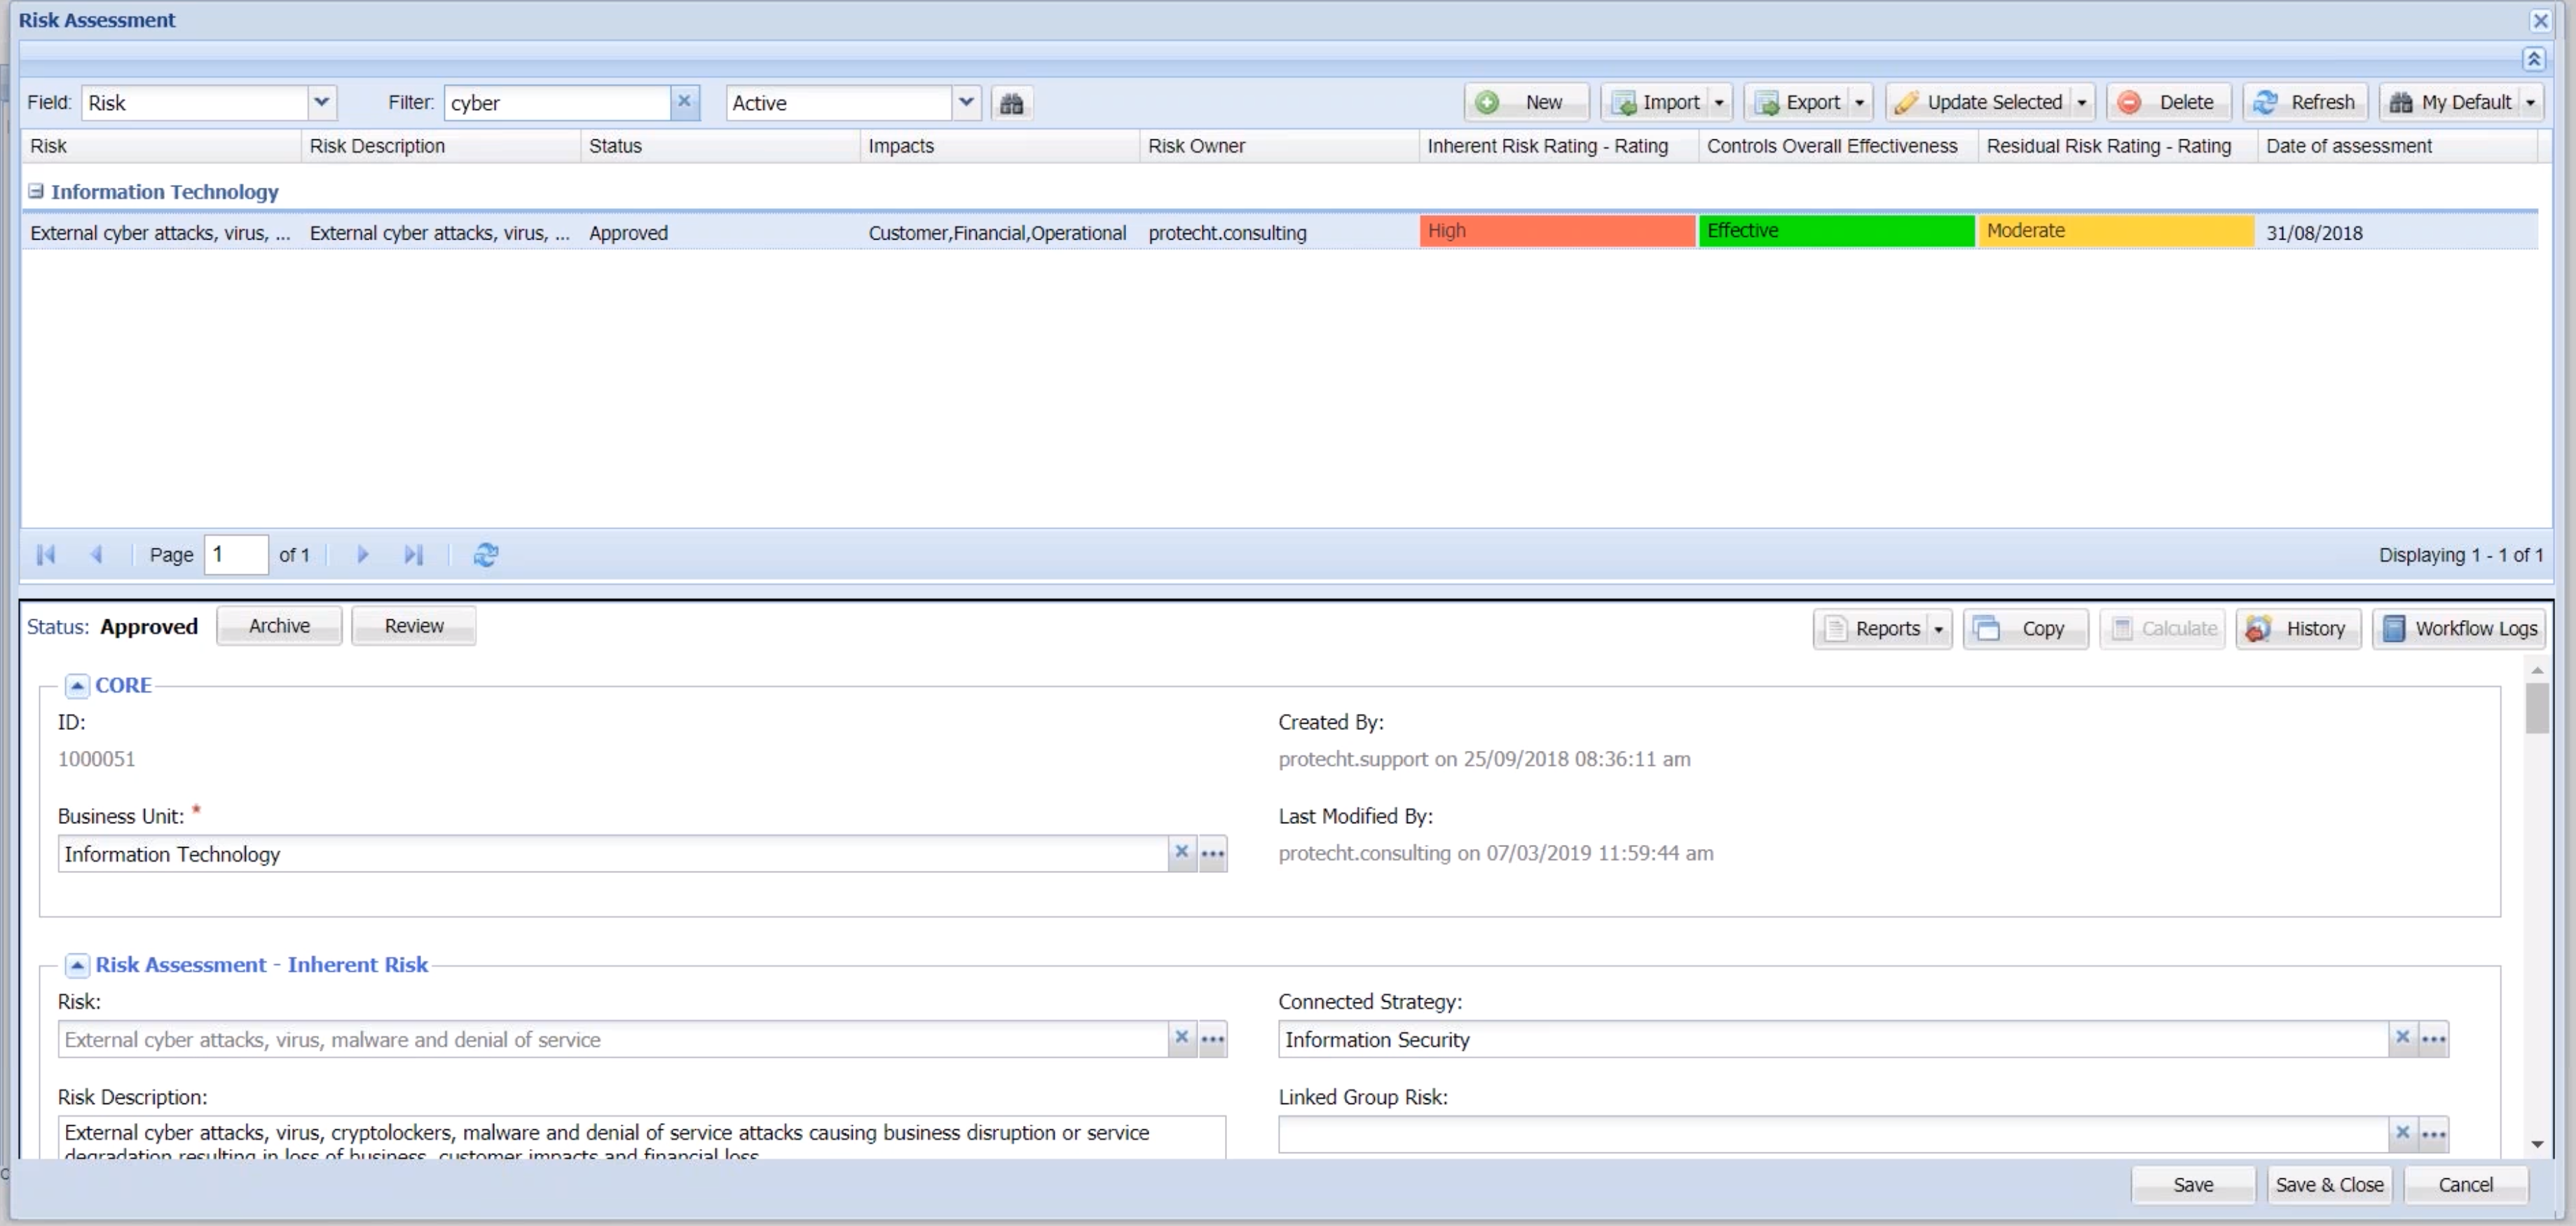
I've got basic information around the owner, inherent risk rating, controls that have been assessed and I can include control testing here and to a rather residual risk position that I either treat or accept.
Key to this form though is really this one field, which is the connection of the risk back to the central library. If I click on those three dots that library should look familiar. It's the one that we just looked at in the core libraries. That enables me to pull any of those key risks into not only this risk assessment form but any of the other forms that are constructed to produce the RiskInMotion concept.
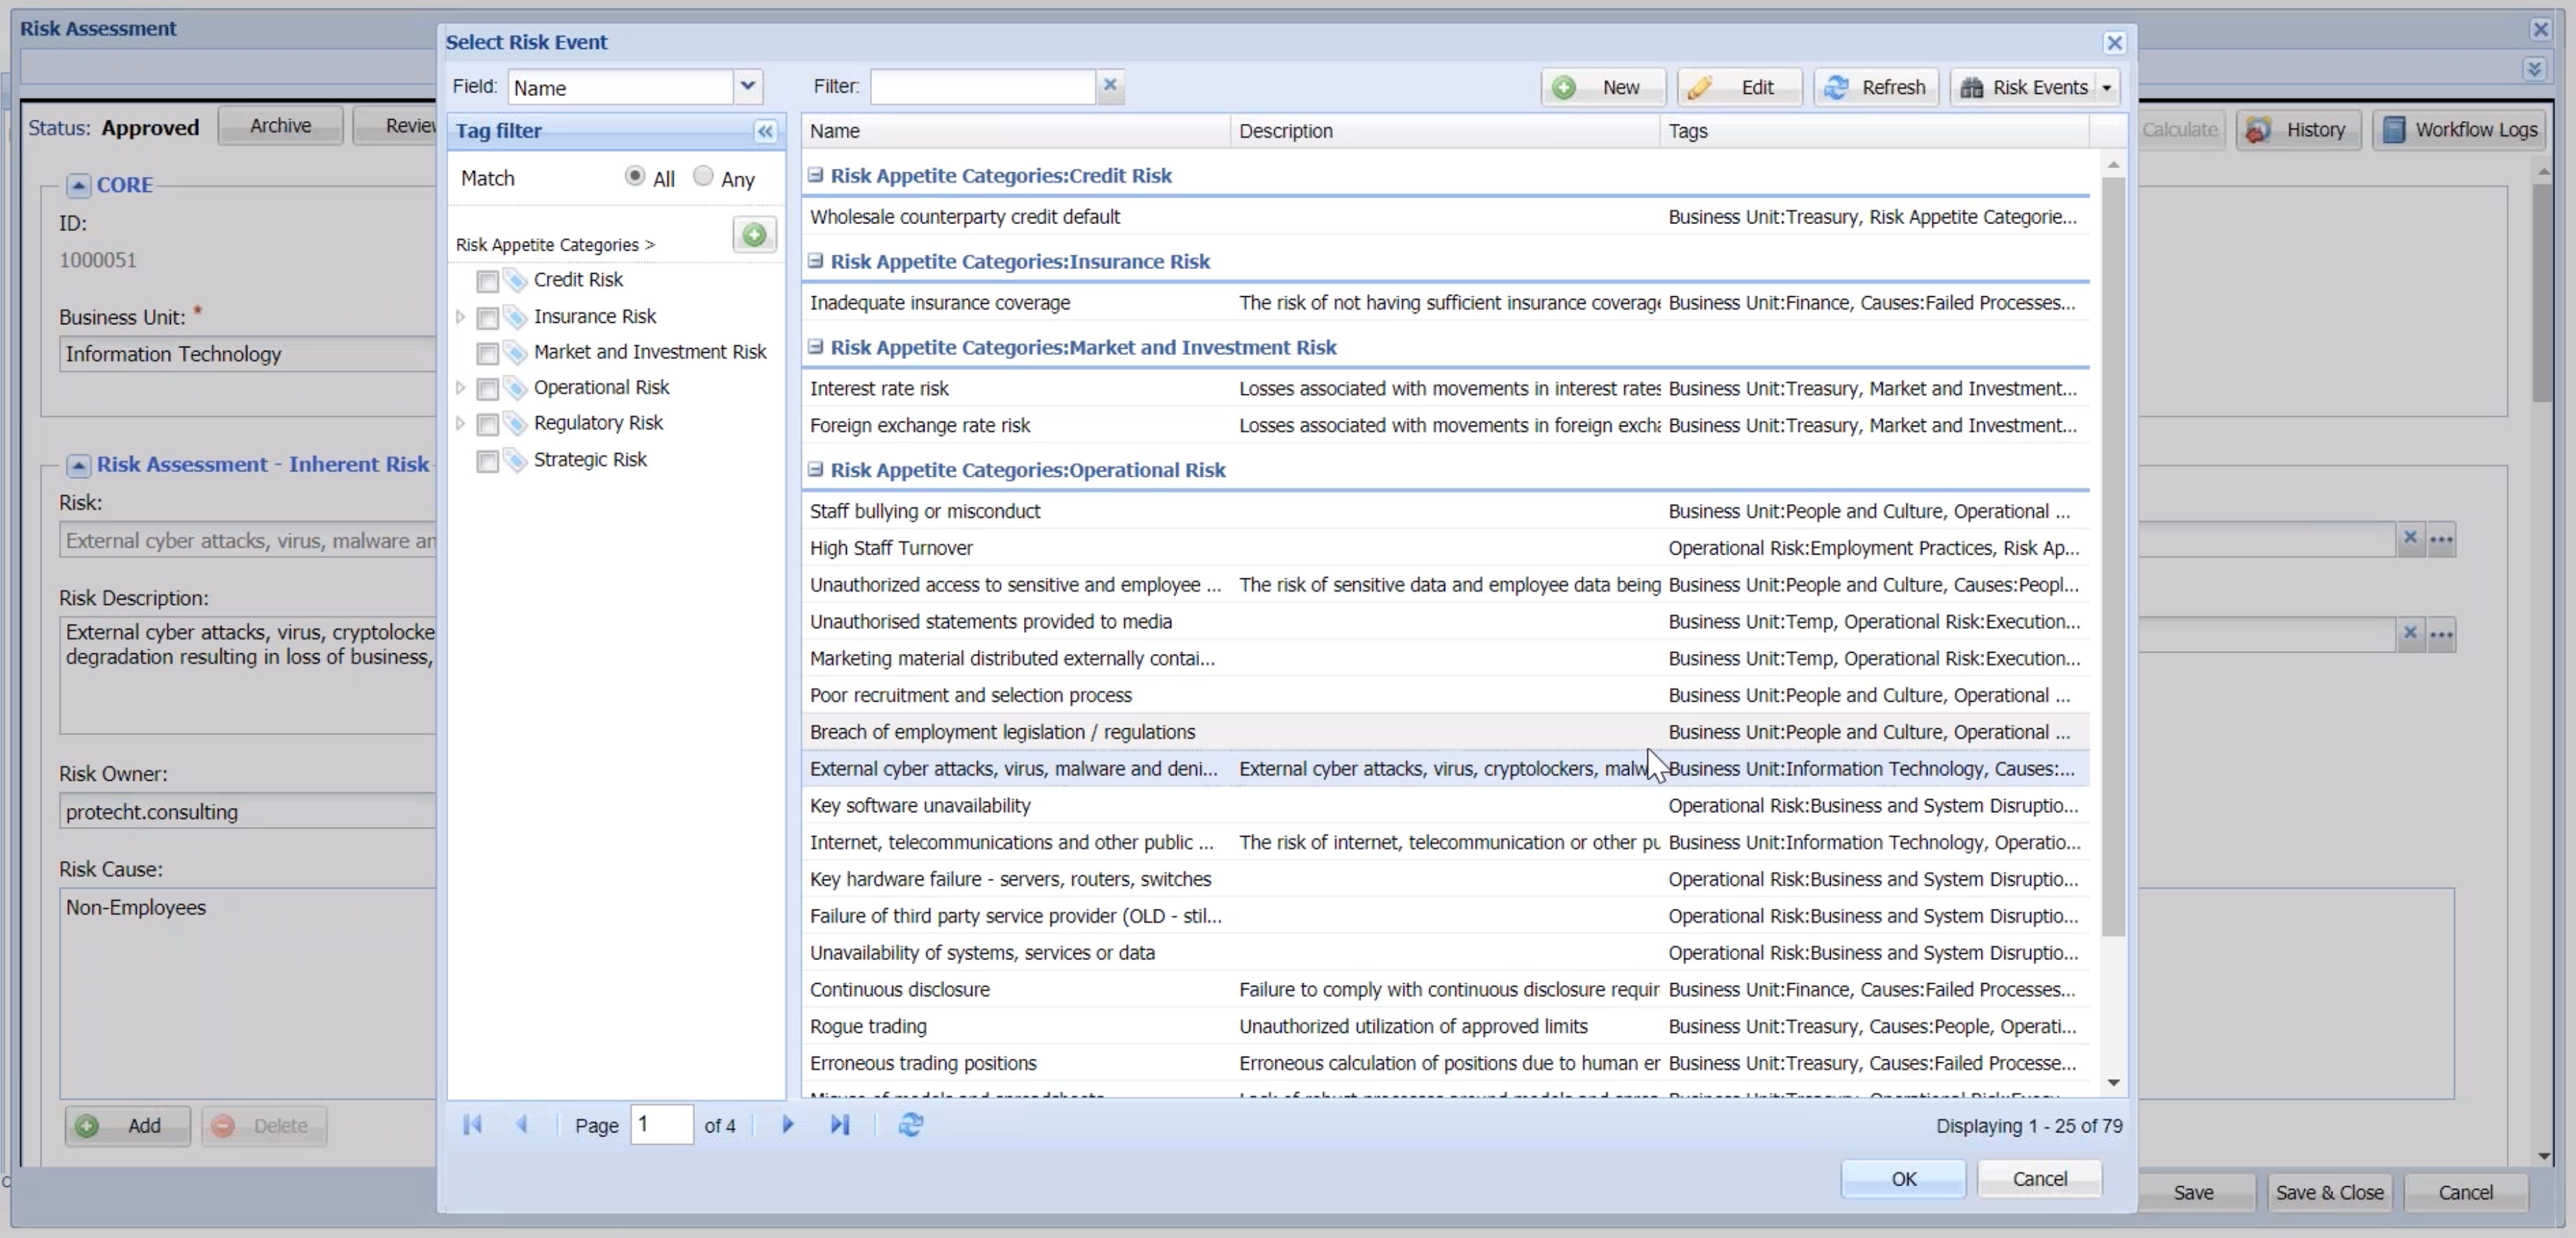
I am going to cancel out of that particular form and I'll move into some of the other forms that Dave mentioned in his presentation. So I will go into applications. You can see there is a number of forms here. BEAR is the equivalent in Australia for SMR in the U.K. If we look at something like the incidents form, and again I will filter for that particular cyber risk event.
You can see that I have got an initial incident notification but when we go, and that initial notification would trigger a work flow email through to the investigation team that sits with the 2nd line.
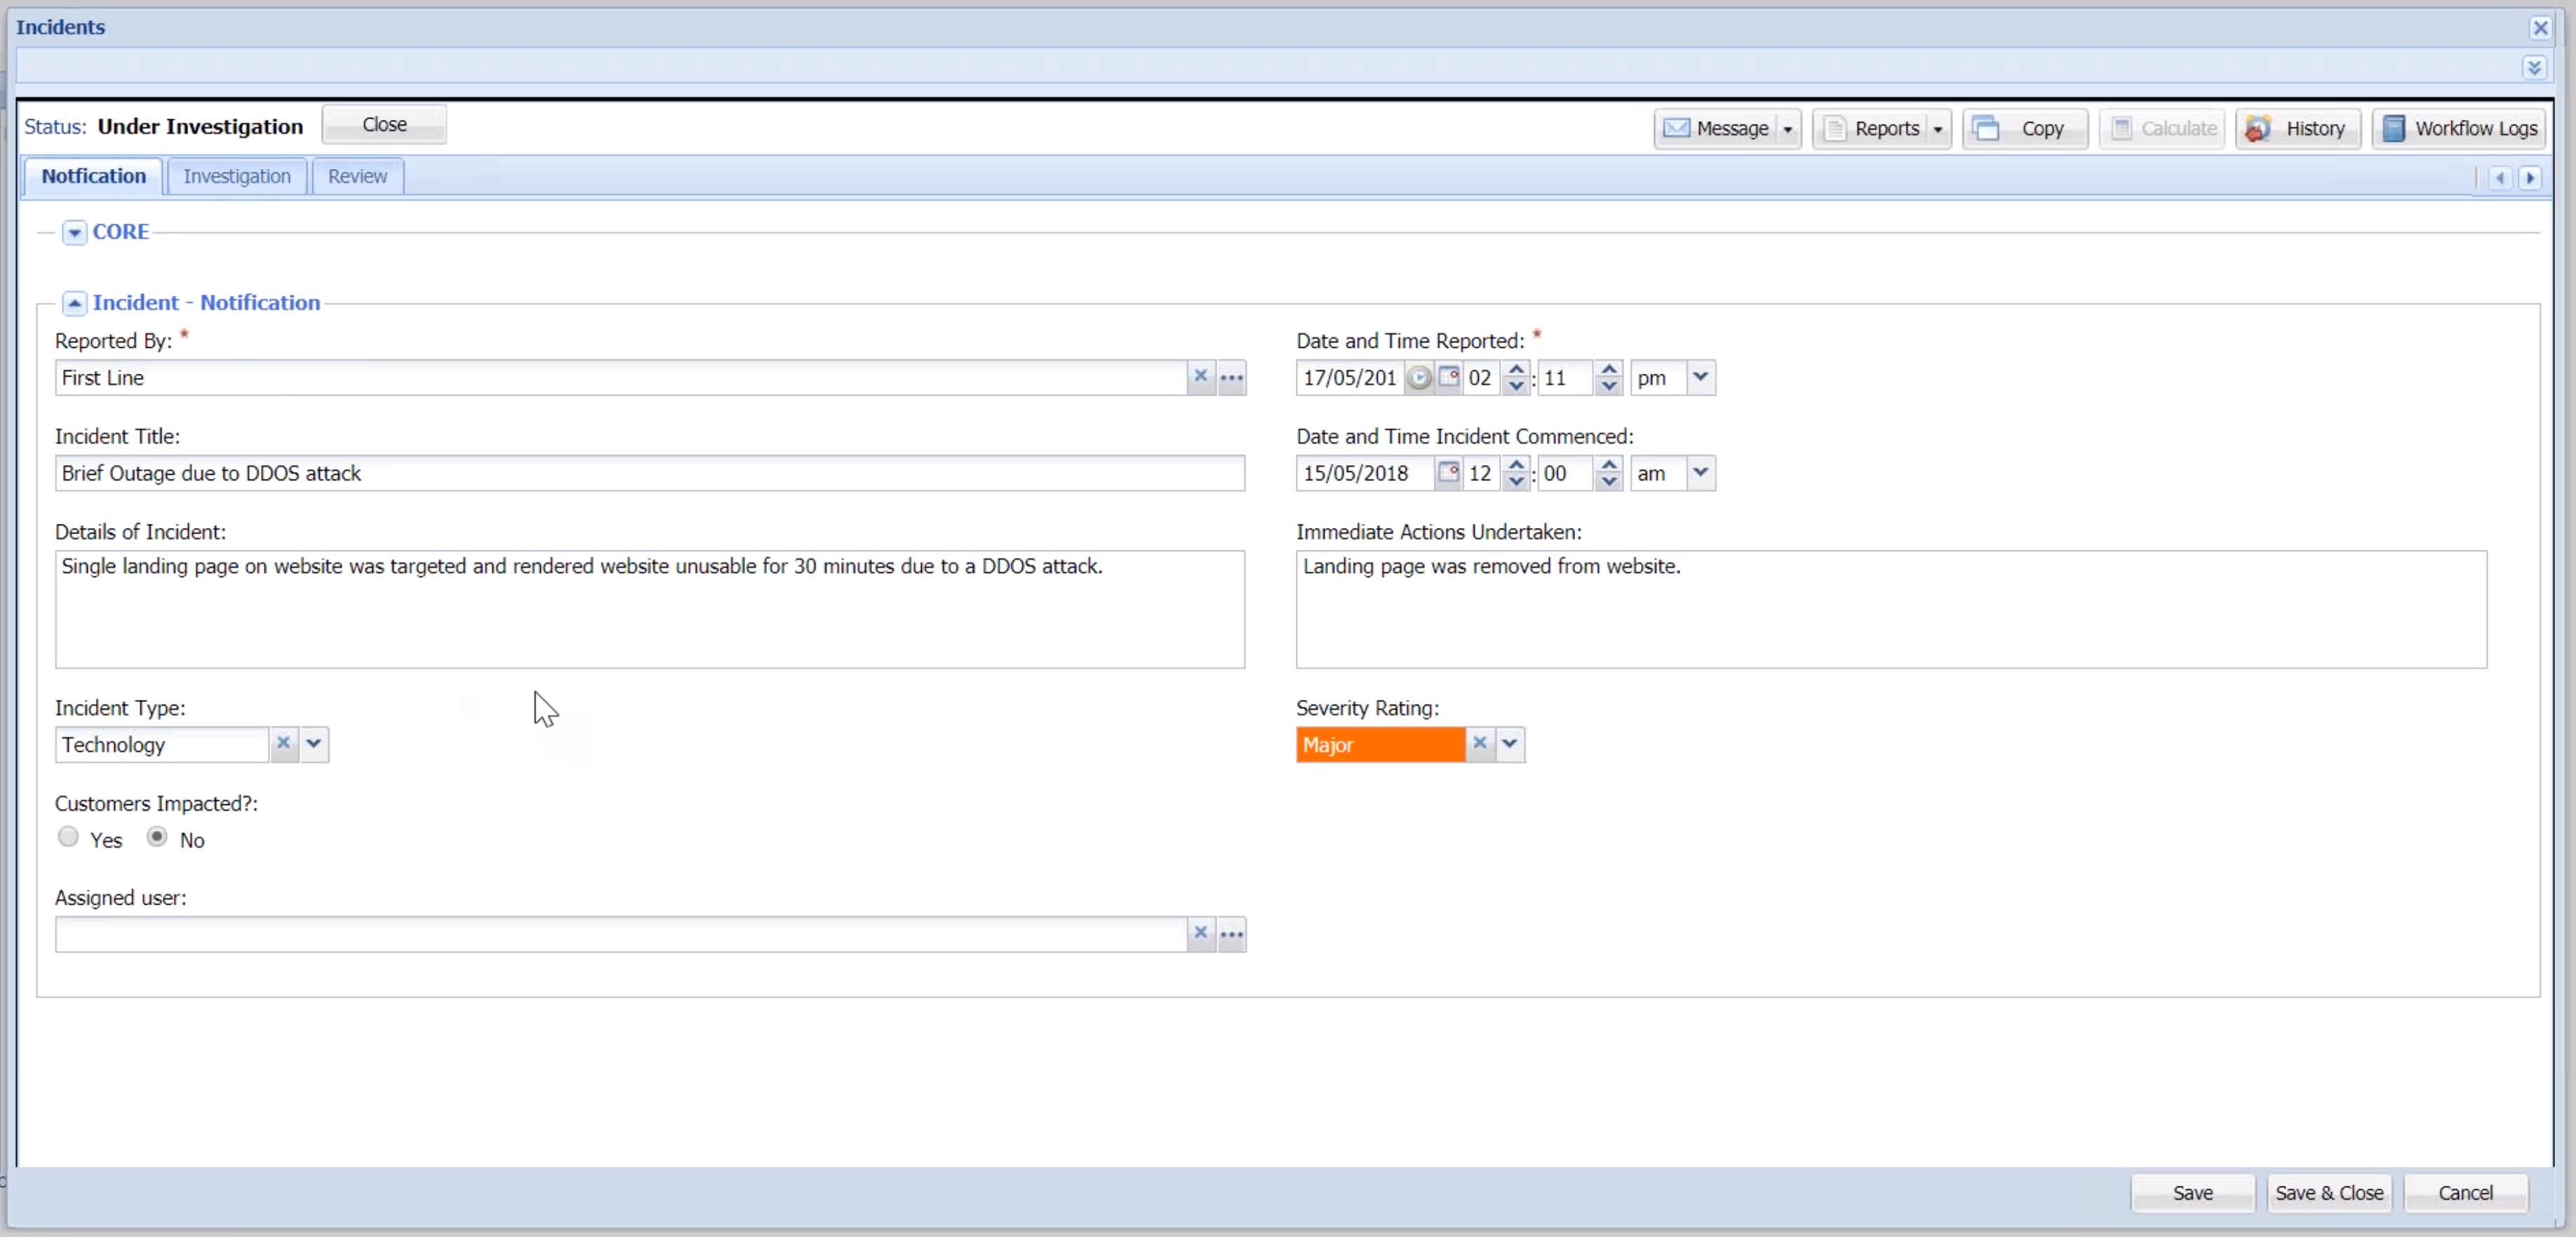
That investigation team can do their own review of that particular incident. Again, consistent with the concept of RiskInMotion we are able to connect that incident to the primary risk event using the library. And again, if I click on those three dots we keep coming back to that central library of risks.
So then keep moving into something like an internal audit finding. I'll sound like a broken down record by the end of this, but you will get the idea. Something like an internal audit findings form. You know traditionally when we think about internal audit findings that might be managed in spreadsheet. The internal auditor is responsible for disseminating those findings via an email, taking the response from the manager, updating it in the Excel spreadsheet, and then hopefully producing something to the board.
In this example though, if we were looking at an audit finding concept is the same in that we have the auditor produce the initial finding and recommendation. The different again with this particular form is that again we connect that finding back to the central library of risks.
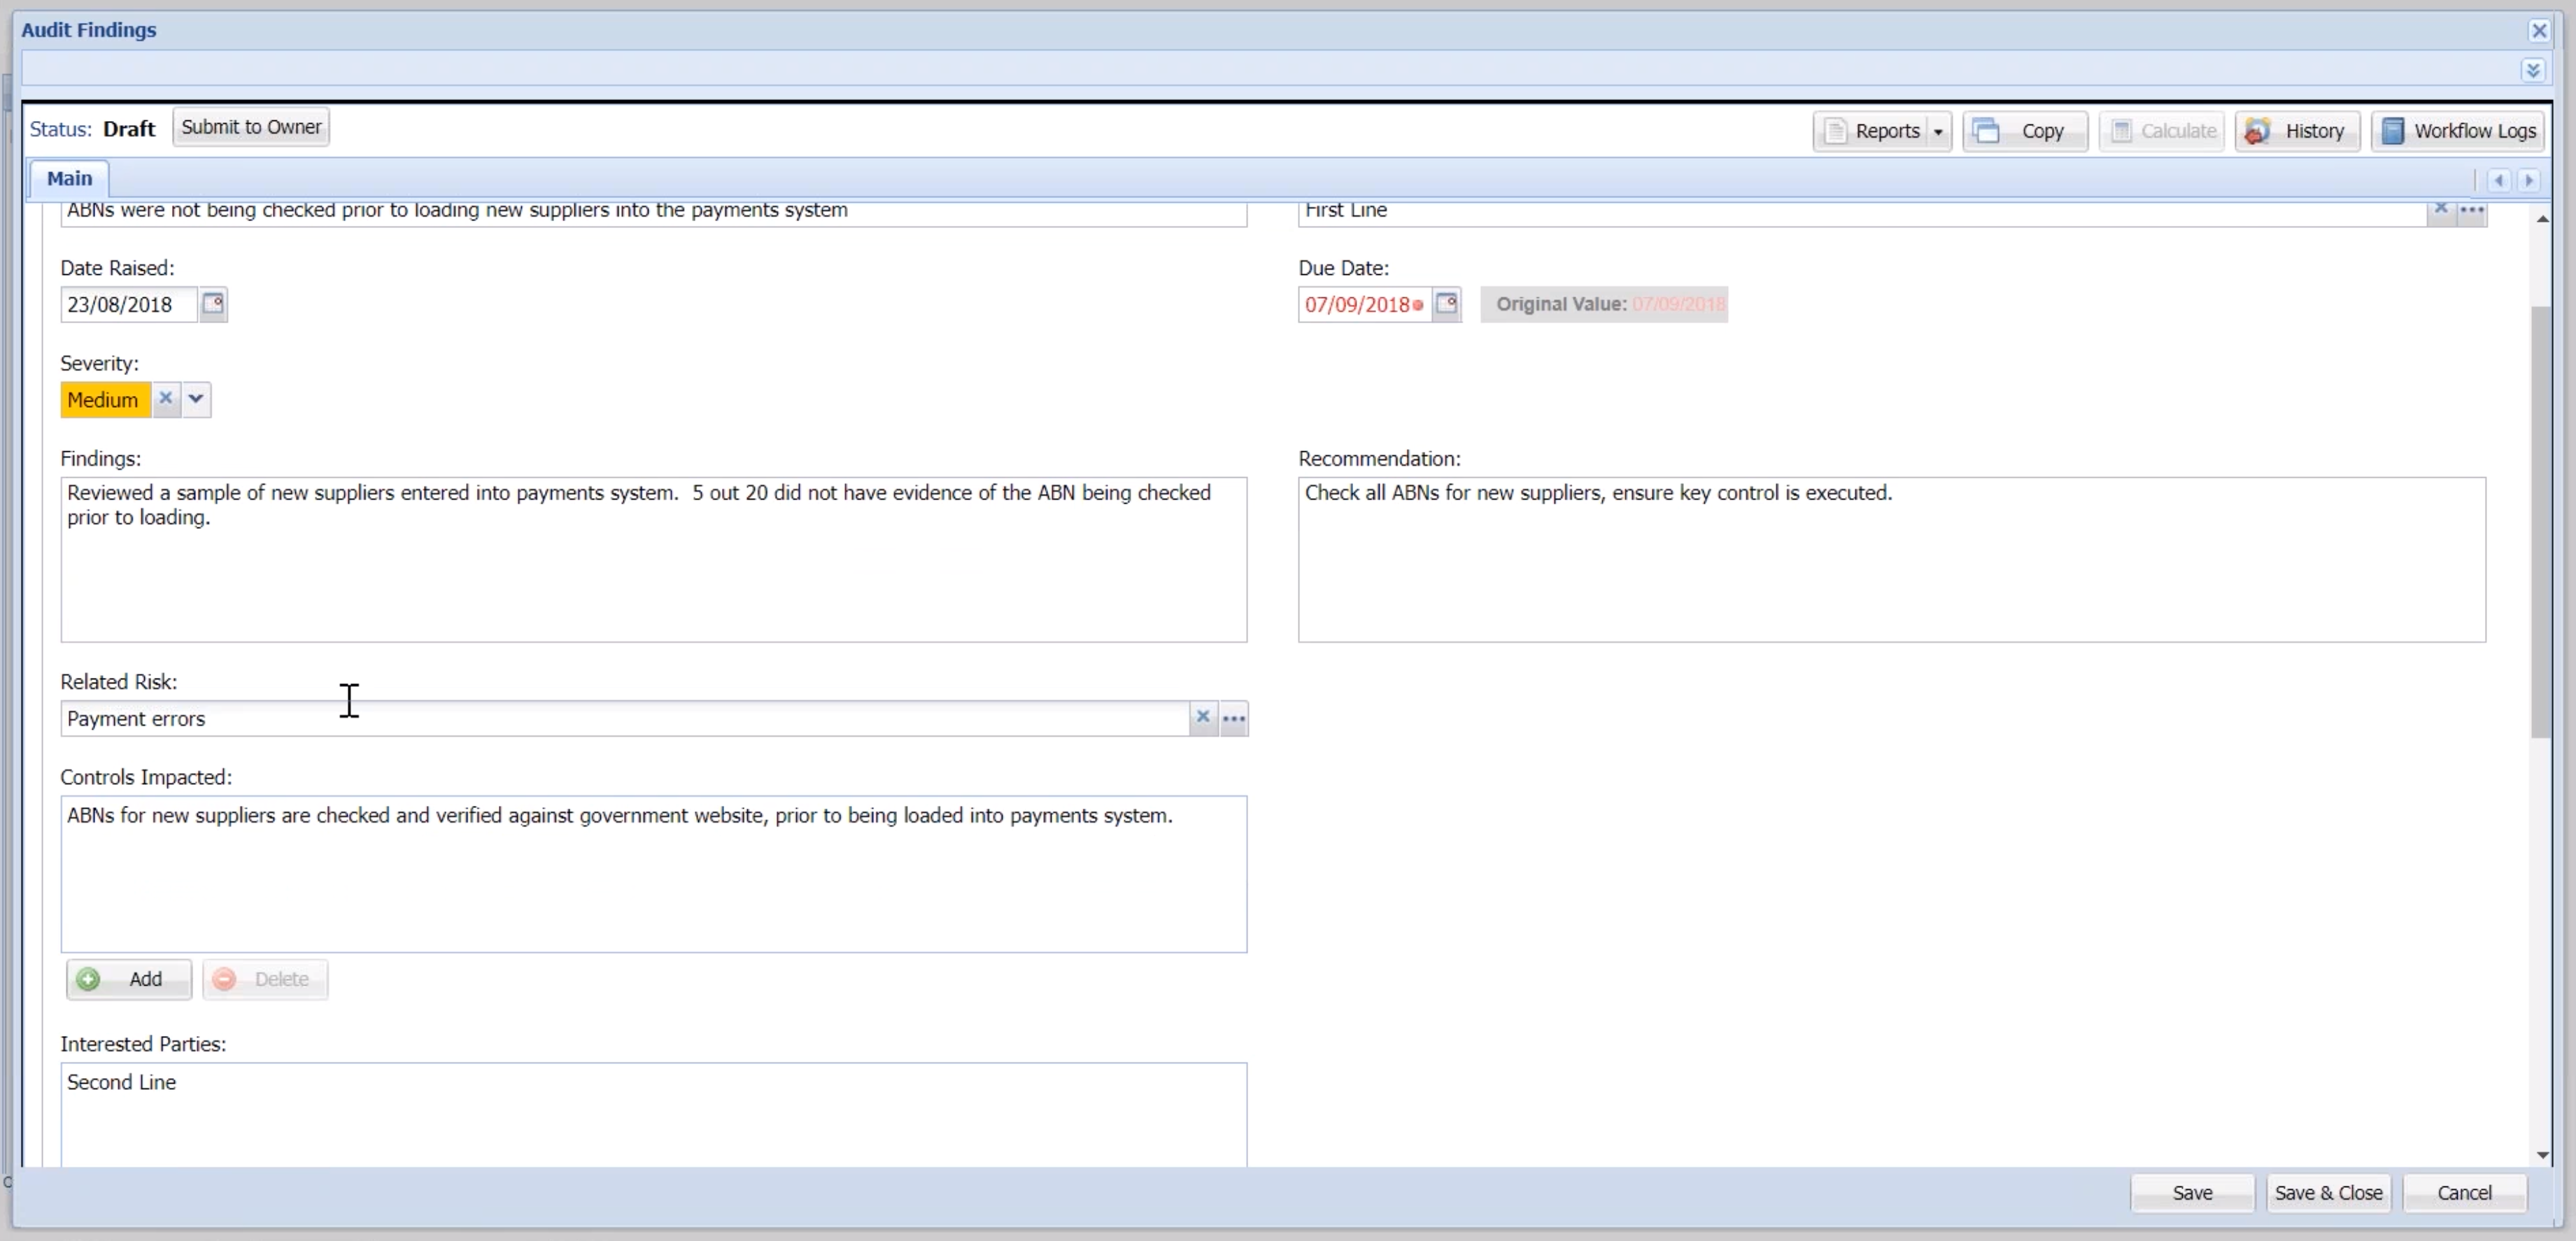
Nowadays we all do risk based audits so if I am going to raise a finding ideally I should have that connection back to the relevant risk that we were auditing in the first place. You will notice also here in this example we have also been able to reference the control library to get a connection back to the particular control that was not performing as expected in the audit.
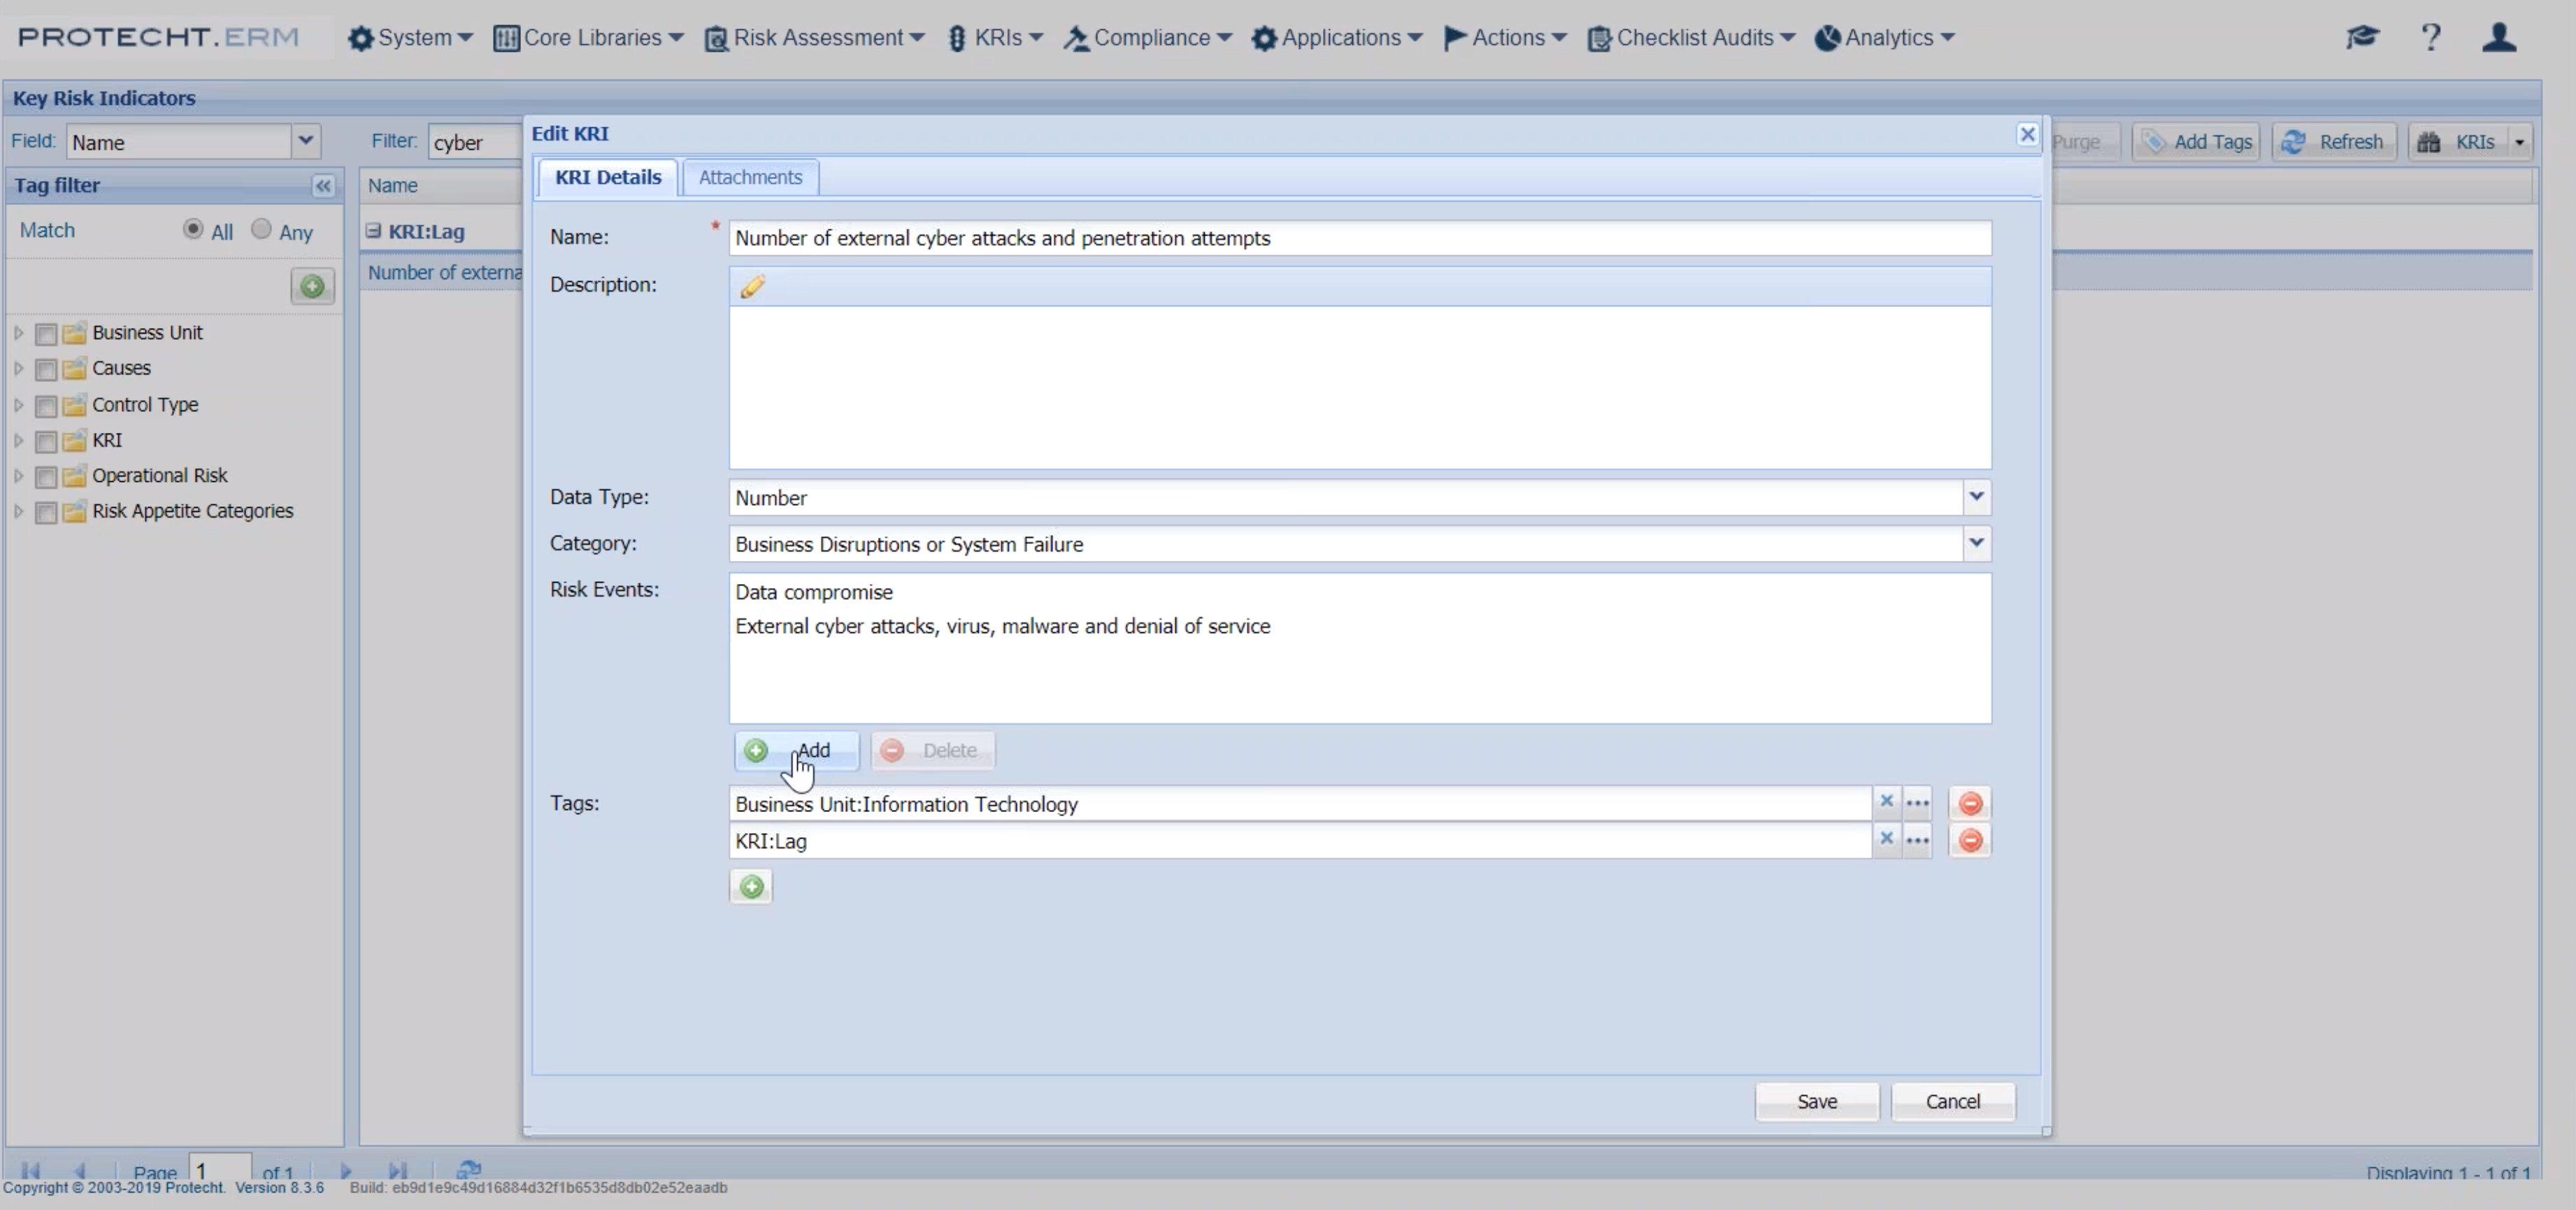
So that is the concept of forms and how those central library of risks can get connected into the particular forms. The same thing happens with the key risk indicators and the compliance attestations. So if we look at something like a key risk indicator library we might have a particular key risk indicator around cyber risk, and again when we create that particular key risk indicator you will see that I have connected that key risk indicator back to the central library for the risk that we were looking at. And if I click on that add button, again same message, we keep coming back to that central library of risks.
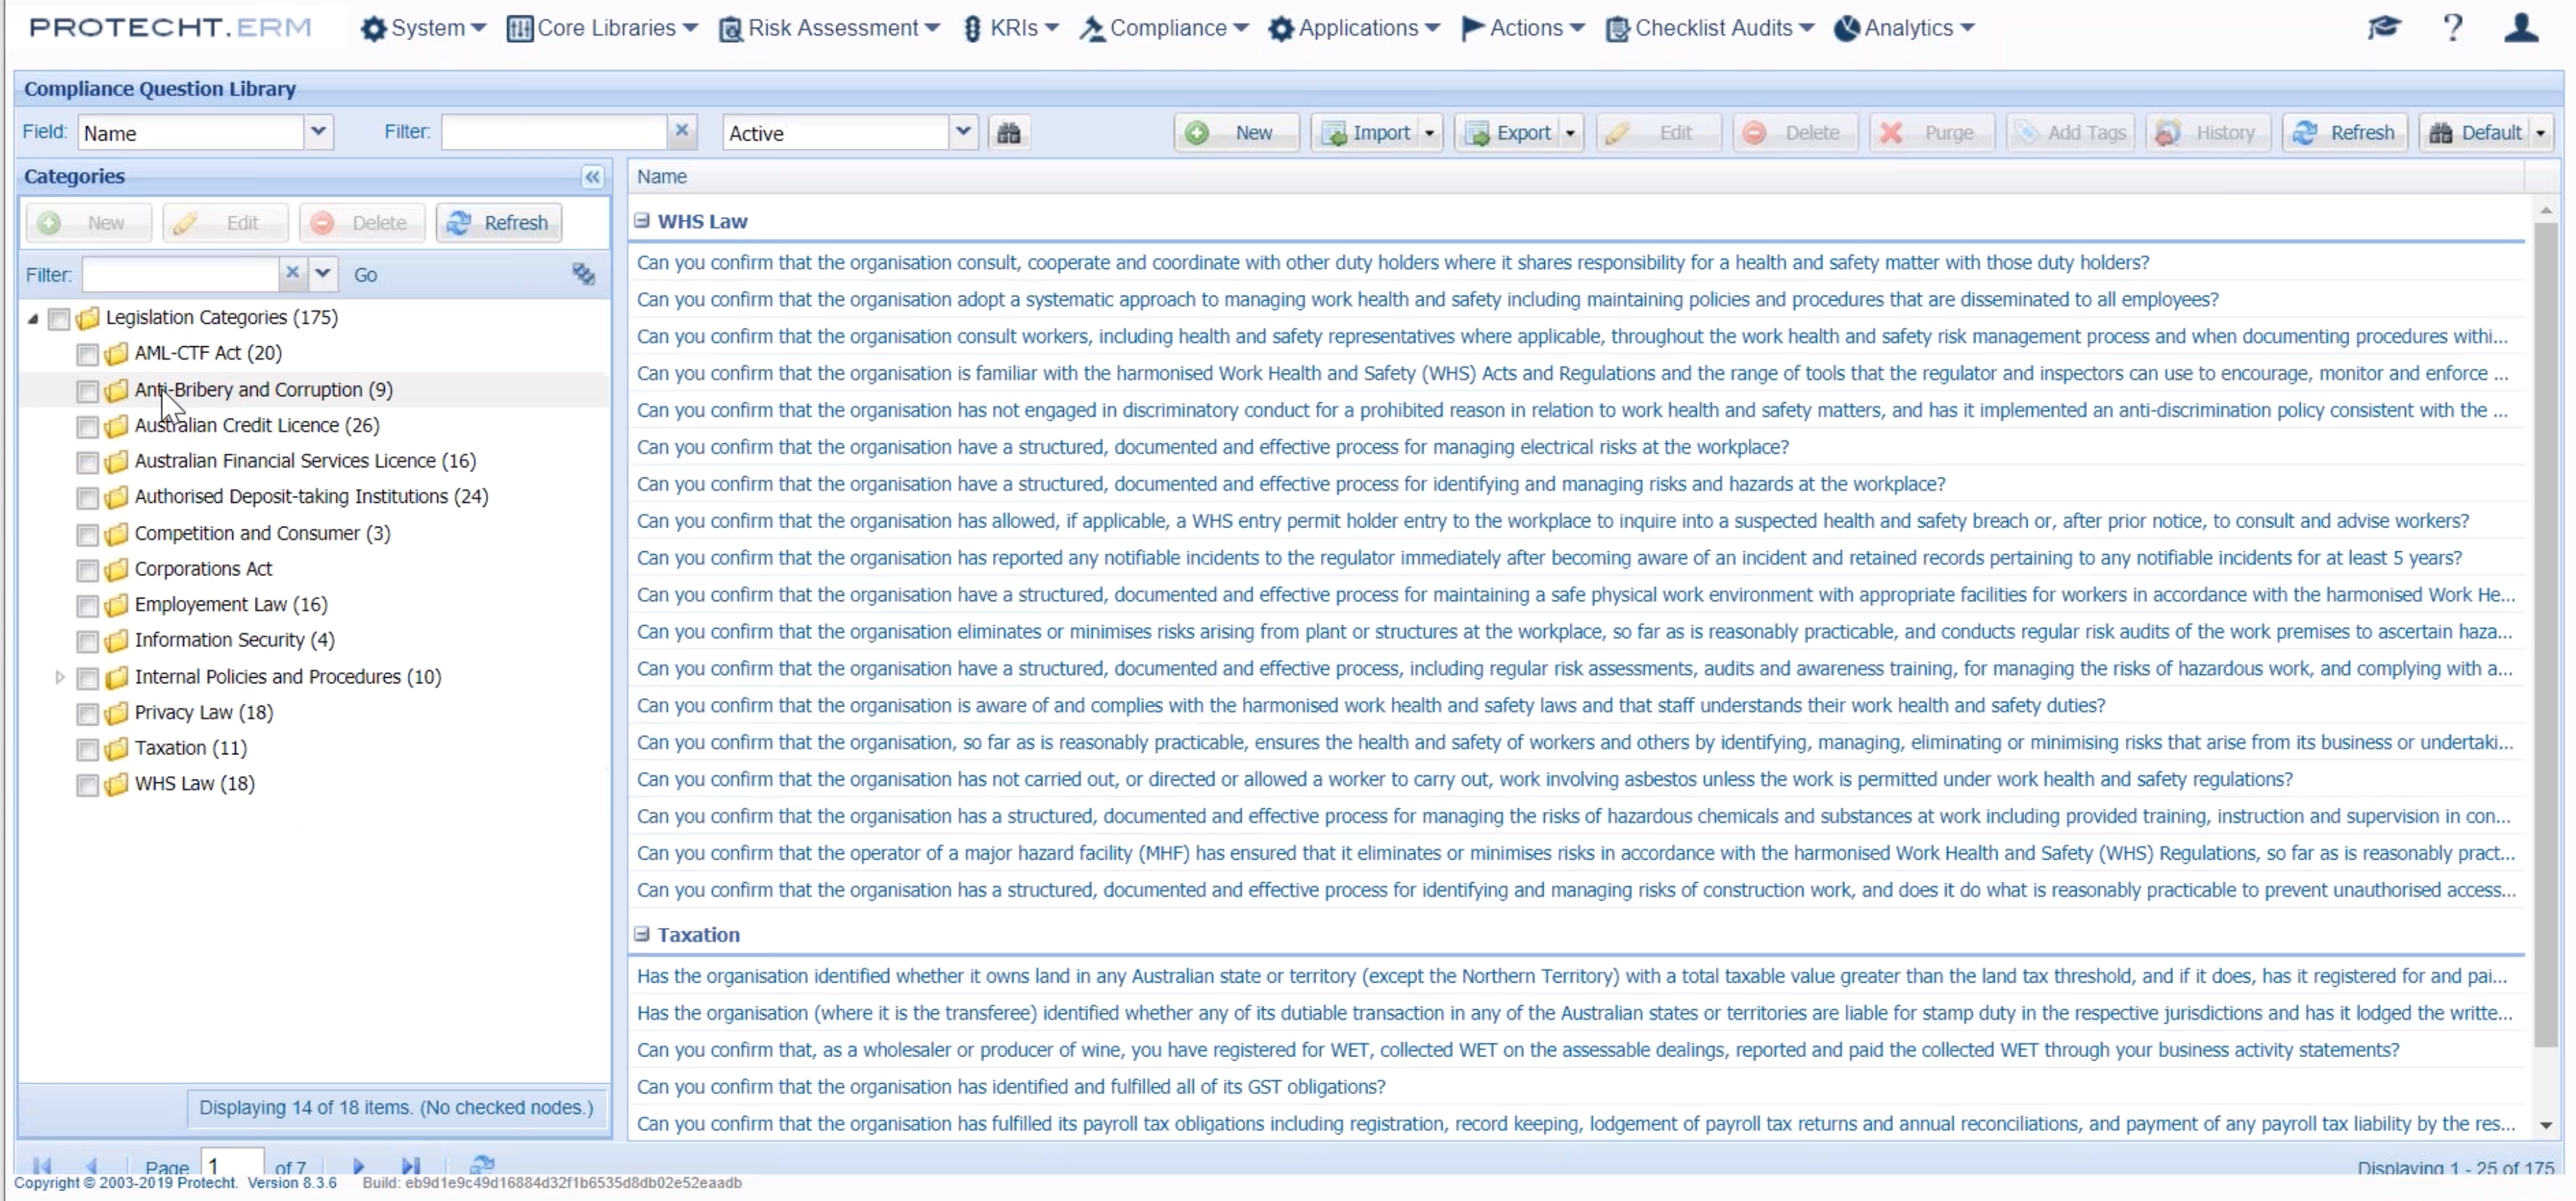
Similarly same concept with the compliance attestation piece. If we are asking questions out to the business on a periodic basis for regulatory compliance or our own internal control framework compliance, again ideally if we can get a connection back to risk for those questions it makes sense to get that connection and roll it up against risk profile.
AML CTF is a great example. There is a number of attestation programs out there for key controls around the AML CTF. Obviously in my risk library I should be having a risk associated with our AML CTF, be it money laundering and CTF or counter terrorism financing would be an example. If I look at my particular library of questions I can have my questions structured in any of those key categories. If I click on something like AML CTF I have got a particular question that again I am able to connect back to the risk of that.
So as we move through the continual monitoring piece for key risk indicators, compliance, internal audit findings, incidents that are being reported on a continual rolling basis within the organisation, the key is that we are then able to start aggregating them against a particular risk profile that we are looking at. So I'll just come back to that launchpad, sorry back to the RiskInMotion and you can see here that if we now start looking at the various components of this dashboard I've got my risks grouped by business unit in this first example down the left hand side. I've got the inherent and residual risk rating that has been done by the 1st line for their interpretation of how that risk is performing. But then we start looking at the various things, such as controlled testing and this example is done on a rolling 12 month basis, so we are looking at:
- Number of tests performed
- Number of tests failed
- Number of attestation questions that are connected to this particular risk, that are asked on a quarterly, monthly, semi annual type basis
- Number that were answered in the negative
- Key risk indicators over the period that we connected to that risk but also outside the appetite range, so within the red zone
- Overdue actions
- Internal audit findings
- Any incidents that were connected to it
This is not a fixed dashboard either, so if there are additional things that we want to connect to the risk profile might be complaints, compliance breaches, we are able to do that. But I guess the key to it is that when we look at it any member of a risk committee should be able to look at this type of dashboard and they should, even with limited risk experience, ask the question what is going on with the cyber attack risk, because I've got a row of things that are indicating from the continual rolling basis that this risk is not being managed well. There are weaknesses in the control environment, weaknesses in the treatment plan and also obviously there are a number of incidents that are popping up.

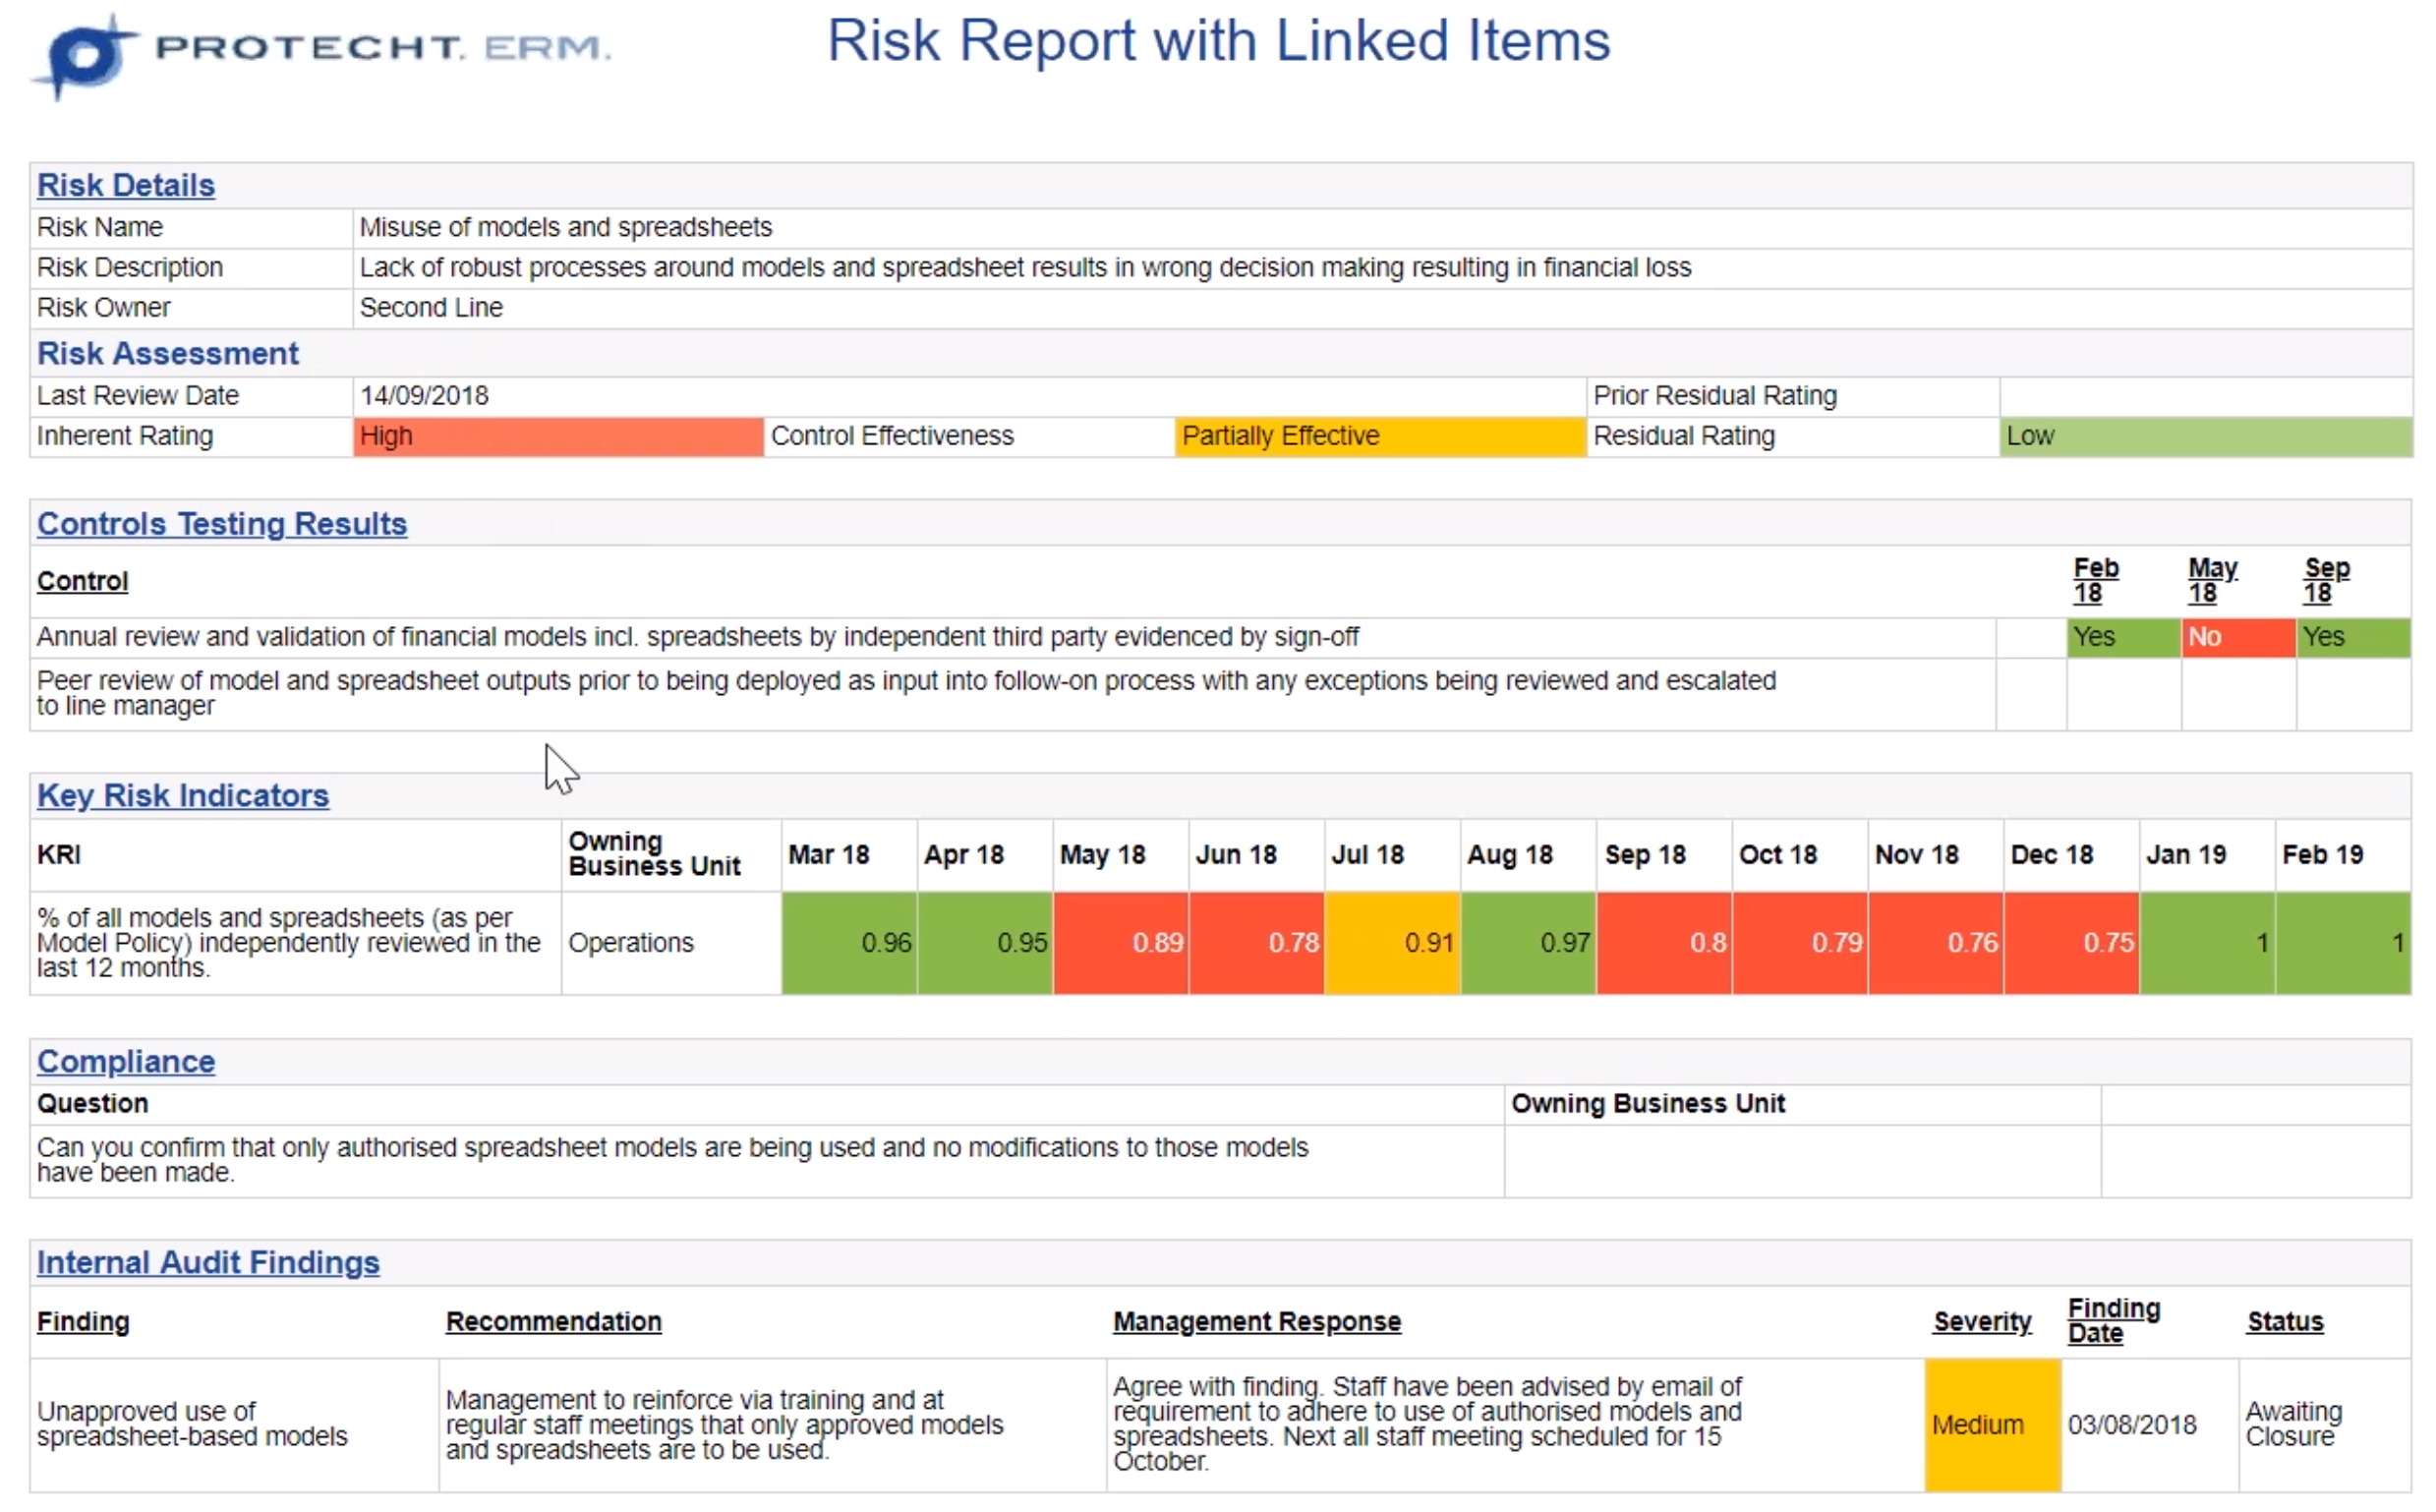
And similarly if we look down at something like another example, the misuse of models and spreadsheets, our eyes are really drawn to those two lines where there is this connected data that's popping up on this dashboard to give us an indication that we need to maybe do a deeper dive into what's going on with that. When it comes to a deeper dive you can see the concept of a hyperlink here. If I click on that particular misuse of models it will drive us through to a report that looks similar to this sort of concept, where we are able to see the underlying detail that makes up that particular aggregated information. So in this example we can see what control was being tested and what failed, what metric was being connected to that particular risk, and which particular months was it outside of its particular appetite range, any internal audit findings in 2nd page which would have the incidents that are also connected to it.
So thats the concept where we look at that particular RiskIn Motion by business unit. I think really quite key to getting the whole enterprise risk GRC platform connected to the risk appetite statement, that is hopefully developed at the top of the organisation and pushed down to 1st line through the work of the risk teams, is the concept of being able to group the risks by the risk appetite category.
So I've got a switch up here that allows me to produce that same report by my key risk appetite categories. When it comes to reporting back to a board, as one of the key stake holders or also the key risk committees, what we are able to do is get a clear connection to the report that we produce for that committee, back to the risk appetite that was developed and hopefully articulating the board's appetite for those key risk areas. So when we think of our traditional risk appetite statements obviously they have got that qualitative assessment of the appetite for risk, but also certainly now there is metrics that are being connected to those risk appetite statements. We can also take it a bit further in connecting all of that other information that Dave introduced us to at the start of the presentation.
That's it for a quick introduction into the concept of RiskInMotion in a platform, and appreciate not all of you have systems, but if you can start thinking about even if you do this in Excel, if you can start thinking about the risk assessment work that's done in Excel, internal audit findings, if we can get some connection back to those central set of risks that are done. That is really what the concept is to produce that more fluid picture of risk that we introduced.
Q&A Session
Now as always, one of the things that we try to do is make sure we finish these webinars early rather than late, and so we have moved through this one fairly quickly. So at this point what we will do is have a look whether any questions have been raised and try to deal with those. So at this stage there is not a lot, if you have got any questions you can push them through into the question panel.
There has been one that's come through about additional webinar topics that may be considered over the coming months:
Will we be doing any more webinars?
Yes, certainly this is our first one for the U.K. market. We will expect to be doing a webinar each month moving forward. David Tattam is one of the great enterprise risk trainers globally, so we will be certainly sharing more educational content over the coming months. I think key topics that have already been considered are centring around control language, control testing, risk appetite, risk appetite concepts, and certainly for the U.K. market, the senior manager's regime and how that fits in.
Another question has just come through from, I won't mention the names, there's one:
What is the cost of the solution?
Obviously depends on the number of users but base pricing for the U.K. market is £20,000 for 20 users, with an implementation fee of roughly similar amount depending on how much you want to do. So reasonably low entry point for that. There's obviously other pricing for data entry type roles.
Is it easy to link risks to multiple business units?
Yeah, that's a great question too. One of the difficulties with, how would I say, if I don't have that central library of risks often the same risk will get called multiple things, slightly different things so we have a disconnect between the same risk across different business units, and if I just go back to that central library, that concept to explain that again.
This is central library risks, the same risk can be connected to multiple business units because one of the key libraries is the business unit structure. If I look at creating a new risk, and we have already assessed cyber risk as an example in the IT department, you will notice there is a business unit up here that references whatever business unit structure you have.
If I wanted to connect cyber risks to the finance department as an example, when finance log in they will be defaulted to that finance business unit and I can just start typing cyber. I've now got a connection of that same risk to a different business unit. So that was that question.
How do strategic risks fit into the categories on your plan?
David Tattam:
I guess the first issue with strategic risk is how do people define it. We look upon it in two main ways:
- Strategic decision risk, which is really about the risk of making a suboptimal decision when you choose your strategy.
- Execution risk, which I guess feeds into project risk management. Then the classic execution risk of project, and then I guess the final one is delivered risk, when you deliver that strategy into the business and how it affects it.
So as much as Dave obviously selected a subset of the risks is that a lot of our clients would have a risk type being strategic risk and then the subsets of decision and execution risk. That would be referenced and linked to the various business, usually the project management office and often a strategic risk register to do to exactly the same concepts as what we had before. So the board would then have a line in their RiskInMotion report that would be about strategic risk, and the same principles that Dave mentioned would apply to those as well.
David Bergmark:
For sure. And I think certainly often strategic risk can be articulated as what are the key strategic risks that the board or the executive team would be considering. So this is a sample of those type of risks that we see from a strategic risk point of view. When it comes to assessing them they are typically just assessed at the exec level and they will sit in a business unit at the top of that tree, be it XYZ. I am not sure if that has answered the question, but to us, strategic risks are just another category of risks. We need to think about how we actually assess those.
How are we able to access the cost for the system?
Please contact Keith Davies. There is a sheet at the end of the presentation that has Keith's details on it. So he will be more than happy.
If an organisation is currently using another tool like Active, could existing data be migrated readily into RiskInMotion?
Yeah, for sure. The way this product works is you can build any form to capture any data, so we could certainly look at that.
It is actually really quite hard to read these questions because it's quite compact.
Do you have any training resources we can use around enterprise risk management?
Yeah, certainly. There is a lot of stuff on our website, we are quite proud of the content that we produce, and David Tattam is certainly coming across to do some courses pretty soon, in the U.K. He is putting out an integrated risk management course on the 18th of March. These are all in London by the way. Risk appetite course on the 19th of March, and Risk and control self assessment course on the 20th of March.
If you are interested in training I strongly recommend seeing Dave. I think because it's getting pretty close there are some discounts available. You just need to hop onto the U.K. website to have a look at that sort of training. Also, we have obviously got a bunch of blogs and eBooks that you can download as well.
Is this risk approach ISO 31000 compliant?
Absolutely. Obviously 31000 was built on the Australian standards but we are certainly compliant with those areas.
Are you able to export print reports at different levels of granularity
That is a really good question because the joys of doing webinars very quickly is that you don't show all of those features. I'll just click on something like incidents dashboard to show you that concept. So this is just looking at incident trends over time and you can see the concept of the dashboard. I have got counts on incidents 12 months trend by business unit, by root cause and type. Details down below if I want to look at them, but if I click on that export you will notice that I have got the ability to export any of these out to those mediums.
So if I click on something like PowerPoint it will push that dashboard out. One of the key objectives for this is to really streamline reporting for risk committees. For us RiskInMotion is at the top of that chain. It's certainly something that can be pushed out quite quickly.
Next question:
I assume that 20K for 20 users you mentioned is a per annum license fee? Where is the data hosted?
Yeah correct, it is a per annum, it is a SaaS product so it is a per annum license fee. Data is hosted with AWS in London for the U.K. market. And yeah, definitely so it's a little bit confusing with you guys at the moment, with BREXIT so we have the ability to host, we have taken the option to have hosting in London in case BREXIT does proceed.
Is there a maximum of user accounts in the system that we can work with?
No, we have clients with up to 15 - 20,000 users on the product.
If you have two areas identifying the same risk event, how can double entries to managed by the 2nd line?
That question we will follow up with because if there are two distinct areas what happens is typically the 2nd line, when it comes to doing an overall assessment of that particular risk, will look at the same risk being assessed by different departments to, how would I say, to form their overall assessment of that particular risk.
Is this a web based or native system?
So it's a web based platform and we do have mobile access as well so it's available for IOS, Android, native mobile app.
Can we define our own risk matrix?
That is a very good question as well, so yes, we can definitely define our own risk matrix. You will see here, if I go into the risk scales you can have multiple risk scales in this platform. So you can define multiple likelihood, multiple impacts. In this example I have got a number of different scales depending on the default of risk, project risk and other components. Then I can obviously do my own matrix. I have done a five by five in this example but you can certainly do anywhere from three up to nine type scale sets.
Thank you, that was one comment so that's great.
Do you have any business case documents?
Absolutely, please contact Keith. He will be able to provide you with a template business case document for that.
Everybody, that is the end of the questions. Really appreciate the questions being asked, that is fantastic. So great engagement, and thank you everybody for attending. We will make sure webinar will be produced next month on a relevant topic and hopefully look forward to seeing you all again soon.
I hand it back over to Keith to close out.
Keith Davies:
Yeah, thank you Dave. As David mentioned the webinar will be sent out to you shortly along with the slides. If you would like any further information we would be very happy to hear from you. My details are on the screen there. So thanks again for your time and have a good day.
Thanks everyone.
What's next
Want to learn more about Protecht.ERM and how it helps with your risk information security? Get in touch with one of our team members today to request a demo.
